
Decoding On-Chain Behavior to Predict Short-Term ETH Price Catalysts
Ethereum's on-chain activity in September 2025 has become a masterclass in decoding market sentiment. Whale behavior—long a barometer for institutional and retail confidence—is painting a nuanced picture of bullish accumulation and short-term volatility. By dissecting these patterns, investors can better navigate the ETH ecosystem's turbulence and identify potential catalysts for price action.
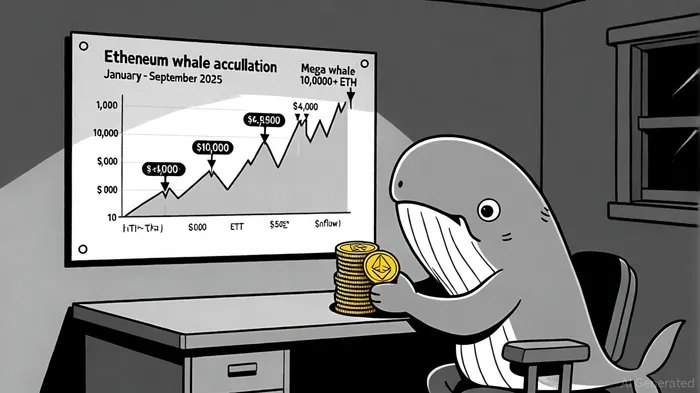
The Bullish Case: Whale Accumulation and Structural Strength
Ethereum's whale activity has mirrored the 2021 bull run, with mid-tier and mega whale wallets doubling their holdings over four months. According to a report by The Currency Analytics, wallets holding 1,000–10,000 ETH added 818,410 ETH—worth $2.5 billion—since June 2025, while mega whale addresses (10,000+ ETH) now number 1,200, a level last seen in 2021 [2]. This surge reflects growing confidence in Ethereum's fundamentals, including its staking dominance (36.15 million ETH staked) and reduced circulating supply [3].
Daily net inflows to whale wallets have also hit record levels. On June 12, 2025, whale wallets added 871,000 ETH in a single day—the highest inflow of the year—indicating that large holders view current price corrections as buying opportunities [4]. This pattern aligns with historical data from 2017, where whale accumulation preceded multi-year rallies [1].
Short-Term Volatility: Exchange Flows and Profit-Taking
While long-term positioning is strong, September has seen conflicting signals. On September 9, a long-dormant whale transferred 45,000 ETH ($194 million) to exchanges, triggering a 1.5% dip to $4,280 [1]. Such moves highlight the fragility of short-term sentiment, as even minor whale activity can amplify volatility.
However, the broader trend remains bullish. Between September 10–17, Ethereum's price rebounded to $4,714, supported by a net outflow of 140,521 ETH from exchanges—a sign of reduced selling pressure [2]. U.S. spot EthereumETH-- ETFs also absorbed 286,000 ETH inflows, underscoring institutional demand [3]. Yet, profit-taking emerged in late September, with whales selling 90,000 ETH ($500 million) and ETF outflows reaching $61.7 million, partly driven by Citigroup's bearish outlook [4].
Key Catalysts to Watch
Support Levels and Staking Dynamics: Ethereum's price has tested the $4,400 support level twice in late September. Analysts like Michael van de Poppe warn that a breakdown could trigger further downside, but staking's record highs (36.15 million ETH) provide a structural floor [4].
ETF Flows and Institutional Demand: ETF inflows remain a critical catalyst. If institutional buying accelerates, Ethereum could retest $5,500, a level last seen during its 2021 breakout [1].
- Whale Behavior: The balance between accumulation and profit-taking will dictate short-term volatility. A sustained net inflow to whale wallets—particularly those holding 10,000+ ETH—would signal a shift toward long-term positioning [2].
Conclusion: Navigating the ETH Ecosystem's Duality
Ethereum's on-chain data reveals a market at a crossroads. While whale accumulation and ETF inflows point to a multi-year bull case, short-term volatility from profit-taking and exchange flows demands caution. Investors should monitor key support levels, staking dynamics, and whale behavior to capitalize on potential catalysts. In a market where sentiment swings rapidly, the ability to decode on-chain signals—like the ones Ethereum is currently emitting—will separate the informed from the reactive.


Comentarios
Aún no hay comentarios