
D-Wave Quantum's 15min chart triggers MACD, KDJ death crosses, bearish signal
PorAinvest
martes, 18 de marzo de 2025, 1:18 pm ET1 min de lectura
QBTS--
D-Wave Quantum, a leading developer of quantum computing systems, software, and services, has seen its stock price extend beyond regular trading hours. According to market data provider Polygon.io, the extended fair market value price for QBTS was last reported at $0.50 [1]. The company's market rank, as evaluated by MarketBeat, stands at 502 out of 661 stocks in the computer and technology sector [1].
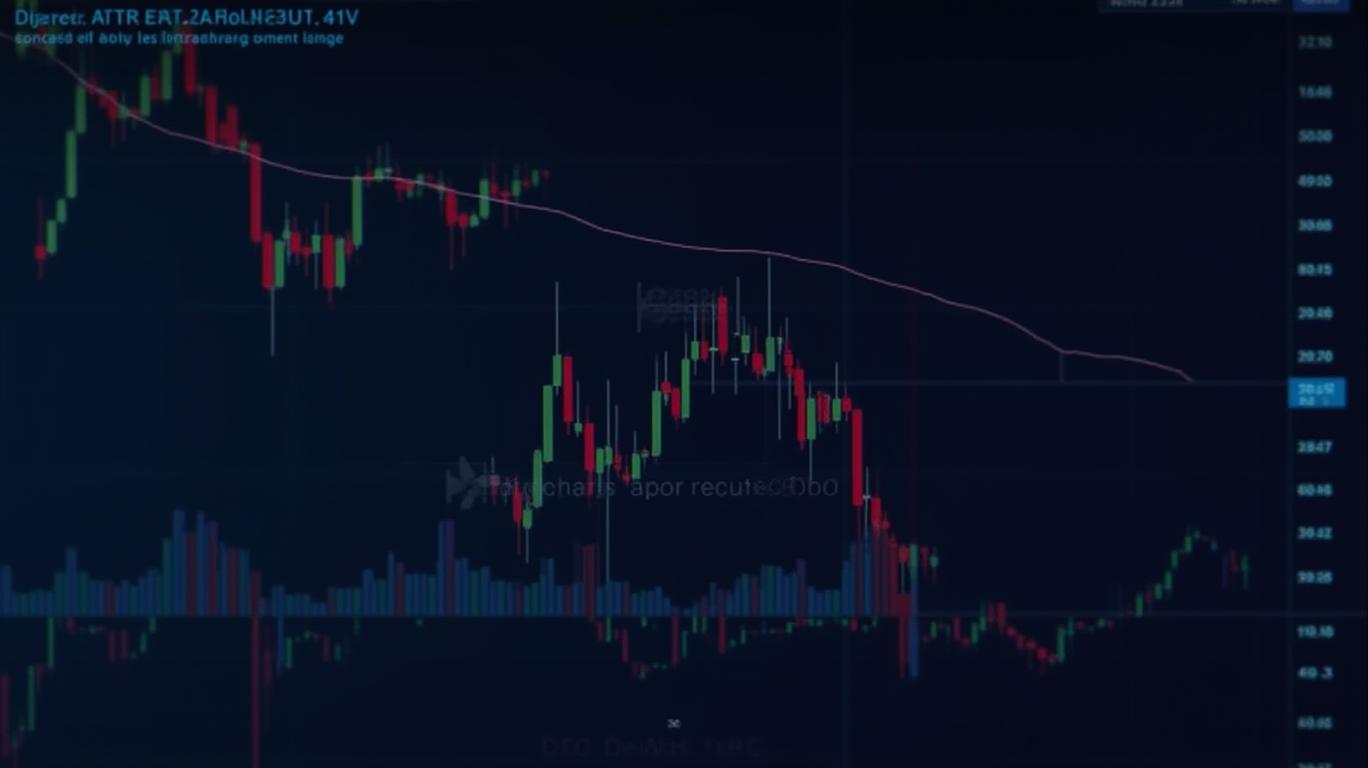
The MACD death cross occurs when the MACD line, which represents the difference between two moving averages, crosses below the signal line. This event is often considered a bearish signal, indicating that the stock's momentum is shifting from positive to negative [2]. The KDJ death cross, on the other hand, occurs when the KDJ line, which measures the difference between the fast and slow stochastic oscillators, crosses below the oversold line. This event is also considered bearish, suggesting that the stock may be oversold and due for a rebound, but the death cross itself may indicate a continued downtrend [3].
It is essential to note that these technical indicators should not be considered in isolation. They should be used in conjunction with other forms of analysis, such as fundamental analysis, to form a well-rounded investment thesis. Additionally, it is crucial to consider the broader market conditions and any company-specific news that may impact D-Wave Quantum's stock price.
In conclusion, the recent MACD and KDJ death crosses on D-Wave Quantum's 15-minute chart suggest that the stock's momentum is shifting towards the downside. While this is a bearish signal, it is essential to consider these indicators in conjunction with other forms of analysis and to remain aware of any company-specific news that may impact the stock's price.
References:
[1] MarketBeat. (n.d.). D-Wave Quantum Inc. (NYSE: QBTS). Retrieved March 19, 2025, from https://www.marketbeat.com/stocks/NYSE/QBTS/
[2] Investopedia. (n.d.). MACD Divergence. Retrieved March 19, 2025, from https://www.investopedia.com/terms/m/macddivergence.asp
[3] Investopedia. (n.d.). Klinger Oscillator. Retrieved March 19, 2025, from https://www.investopedia.com/terms/k/klingeroscillator.asp
QUBT--
The 15-minute chart for D-Wave Quantum's stock price has recently triggered both a MACD Death Cross and a KDJ Death Cross, as of March 18, 2025 at 13:15. This technical indicator suggests that the stock price has the potential to continue declining, as momentum is shifting towards the downside and may further decrease.
The 15-minute chart for D-Wave Quantum's (NYSE: QBTS) stock price has recently exhibited a concerning technical pattern. As of March 18, 2025, at 13:15, both the Moving Average Convergence Divergence (MACD) and the Klinger Oscillator (KDJ) have triggered death crosses [1]. These technical indicators suggest that the stock's momentum is shifting towards the downside, potentially signaling further declines.D-Wave Quantum, a leading developer of quantum computing systems, software, and services, has seen its stock price extend beyond regular trading hours. According to market data provider Polygon.io, the extended fair market value price for QBTS was last reported at $0.50 [1]. The company's market rank, as evaluated by MarketBeat, stands at 502 out of 661 stocks in the computer and technology sector [1].
The MACD death cross occurs when the MACD line, which represents the difference between two moving averages, crosses below the signal line. This event is often considered a bearish signal, indicating that the stock's momentum is shifting from positive to negative [2]. The KDJ death cross, on the other hand, occurs when the KDJ line, which measures the difference between the fast and slow stochastic oscillators, crosses below the oversold line. This event is also considered bearish, suggesting that the stock may be oversold and due for a rebound, but the death cross itself may indicate a continued downtrend [3].
It is essential to note that these technical indicators should not be considered in isolation. They should be used in conjunction with other forms of analysis, such as fundamental analysis, to form a well-rounded investment thesis. Additionally, it is crucial to consider the broader market conditions and any company-specific news that may impact D-Wave Quantum's stock price.
In conclusion, the recent MACD and KDJ death crosses on D-Wave Quantum's 15-minute chart suggest that the stock's momentum is shifting towards the downside. While this is a bearish signal, it is essential to consider these indicators in conjunction with other forms of analysis and to remain aware of any company-specific news that may impact the stock's price.
References:
[1] MarketBeat. (n.d.). D-Wave Quantum Inc. (NYSE: QBTS). Retrieved March 19, 2025, from https://www.marketbeat.com/stocks/NYSE/QBTS/
[2] Investopedia. (n.d.). MACD Divergence. Retrieved March 19, 2025, from https://www.investopedia.com/terms/m/macddivergence.asp
[3] Investopedia. (n.d.). Klinger Oscillator. Retrieved March 19, 2025, from https://www.investopedia.com/terms/k/klingeroscillator.asp
Divulgación editorial y transparencia de la IA: Ainvest News utiliza tecnología avanzada de Modelos de Lenguaje Largo (LLM) para sintetizar y analizar datos de mercado en tiempo real. Para garantizar los más altos estándares de integridad, cada artículo se somete a un riguroso proceso de verificación con participación humana.
Mientras la IA asiste en el procesamiento de datos y la redacción inicial, un miembro editorial profesional de Ainvest revisa, verifica y aprueba de forma independiente todo el contenido para garantizar su precisión y cumplimiento con los estándares editoriales de Ainvest Fintech Inc. Esta supervisión humana está diseñada para mitigar las alucinaciones de la IA y garantizar el contexto financiero.
Advertencia sobre inversiones: Este contenido se proporciona únicamente con fines informativos y no constituye asesoramiento profesional de inversión, legal o financiero. Los mercados conllevan riesgos inherentes. Se recomienda a los usuarios que realicen una investigación independiente o consulten a un asesor financiero certificado antes de tomar cualquier decisión. Ainvest Fintech Inc. se exime de toda responsabilidad por las acciones tomadas con base en esta información. ¿Encontró un error? Reportar un problema

SOBRE NOSOTROS
Nuestra historiaAutores de noticiasBase de conocimientosPolítica de privacidadTérmino de usoDescargo de responsabilidad de corretaje de tercerosTérminos de uso de AIMEDivulgaciones de riesgos de AInvest AICarrerasCONTÁCTENOS
Email: support@ainvest.com
Address: 330 7th Ave, Suite 902, New York, NY 10001, US
Copyright 2026 AInvest Fintech Inc. All rights reserved.
Comentarios
Aún no hay comentarios