
CoreWeave Jumps 8.85% On Bullish Engulfing Pattern As Technicals Signal Rebound
Generado por agente de IAAinvest Technical Radar
jueves, 3 de julio de 2025, 6:01 pm ET2 min de lectura
CRWV--
Candlestick Theory
CoreWeave's recent price action exhibits a potential reversal signal following two consecutive bearish sessions. The 8.85% surge on July 3 formed a robust bullish candle that eclipsed the prior two days’ declines, closing near the session high of $166.22. This pattern, resembling a bullish engulfing formation, suggests strong buying pressure at the $151–$153 support zone. Key resistance emerges at $173.35 (June 30 high), while sustained closes below $153.55 would invalidate this bullish momentum. The long upper wick on June 25 ($180.25 high) reinforces $180–$183 as a major resistance barrier, historically triggering sharp pullbacks.
Moving Average Theory
The 50-day moving average (approximated at $142) currently slopes upward beneath price action, confirming a short-term uptrend. However, the 200-day MA (around $99) and 100-day MA (approximately $120) remain significantly below, reflecting CoreWeave’s volatile multi-month ascent. The July 1–2 dip briefly tested the 50-day support before rebounding—a sign of healthy trend adherence. Golden crosses persist between shorter and longer-term averages, but extended price deviations warn of potential mean-reversion risks if the 50-day MA fails to hold.
MACD & KDJ Indicators
MACD lines crossed bullishly on July 3 after hovering near the zero line, signaling renewed upward momentum. Histogram bars shifted positive, though divergence remains against the June peak ($183.98). KDJ oscillators concurrently exited oversold territory (K-line: 25→45; D-line: 20→42), with the %J curve accelerating north. This synchronized improvement suggests short-term upside potential. However, both indicators lack decisive strength compared to mid-June readings, implying constrained bullish conviction near all-time highs.
Bollinger Bands
Bollinger bandwidth contracted markedly in late June, climaxing in the July 3 breakout above the upper band ($163). This volatility surge after compression typically precedes strong directional moves. Price now trades 9% above the 20-day midline ($151.7), indicating overextended conditions relative to recent averages. A retracement toward the $155–$158 band midline appears probable to alleviate bullish excess. Historical band touches at $183 (June) and $165 (May) highlight these as magnet zones for profit-taking.
Volume-Price Relationship
July 3’s 8.85% rally occurred on 10.4M shares—modest relative to June’s 17–31M share capitulation events. This divergence undermines breakout credibility, suggesting limited institutional participation. Notably, June 20–23 downsways saw anomalously high volume (26M–31M shares) near $183 resistance, confirming distribution. For sustained upside, CoreWeaveCRWV-- requires volume expansion above 15M shares to validate clearance of $166–$170 supply.
Relative Strength Index (RSI)
The 14-day RSI rebounded from 42 (July 2) to 58 (July 3), neutralizing near-term oversold risks but remaining below the overbought threshold (>70). This mid-range positioning allows room for additional gains. However, bearish divergence persists: June’s $183 peak coincided with RSI 75, while July’s rally lacks equivalent momentum strength. The indicator’s failure to reclaim 60–65 during rebounds would signal deteriorating bullish momentum.
Fibonacci Retracement
Applying Fibonacci to the April–June rally ($37.08 to $183.58) reveals key levels. The 23.6% retracement ($155) provided support during July’s consolidation, while the 38.2% level ($142) aligns with the 50-day MA. The latest rebound from $151.26 occurred just above the 23.6% threshold—a technically precise reaction. Confluence exists at the 50% retracement ($110), overlapping with the 200-day MA and volume-weighted support. A decisive break below $155 would expose $142 next.
Confluence & Divergence Summary
Confluent bullish signals emerge at $151–$155, where Candlestick support, Fibonacci 23.6%, Bollinger midline, and volume accumulation converge. Conversely, bearish divergence appears between price momentum (higher July highs) and volume/RSI (lower peaks), questioning breakout durability. KDJ and MACD alignment suggests short-term upside toward $173–$180 resistance, but limited volume conviction and overextended Bollinger positioning advocate for cautious momentum plays. The 50-day MA’s trajectory near $145 remains critical for trend health.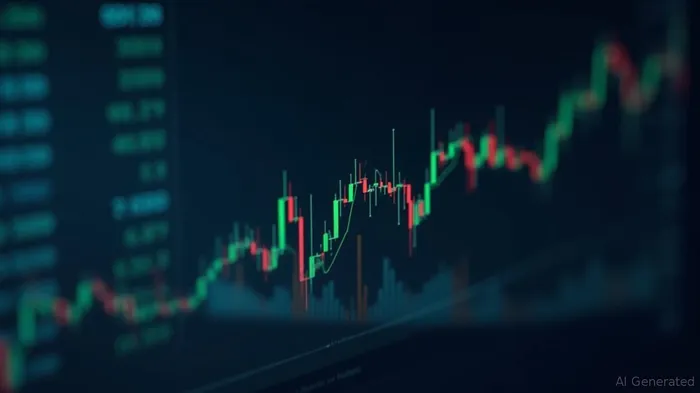
Divulgación editorial y transparencia de la IA: Ainvest News utiliza tecnología avanzada de Modelos de Lenguaje Largo (LLM) para sintetizar y analizar datos de mercado en tiempo real. Para garantizar los más altos estándares de integridad, cada artículo se somete a un riguroso proceso de verificación con participación humana.
Mientras la IA asiste en el procesamiento de datos y la redacción inicial, un miembro editorial profesional de Ainvest revisa, verifica y aprueba de forma independiente todo el contenido para garantizar su precisión y cumplimiento con los estándares editoriales de Ainvest Fintech Inc. Esta supervisión humana está diseñada para mitigar las alucinaciones de la IA y garantizar el contexto financiero.
Advertencia sobre inversiones: Este contenido se proporciona únicamente con fines informativos y no constituye asesoramiento profesional de inversión, legal o financiero. Los mercados conllevan riesgos inherentes. Se recomienda a los usuarios que realicen una investigación independiente o consulten a un asesor financiero certificado antes de tomar cualquier decisión. Ainvest Fintech Inc. se exime de toda responsabilidad por las acciones tomadas con base en esta información. ¿Encontró un error? Reportar un problema

Comentarios
Aún no hay comentarios