
Chart of the day 3-10: UPST

# UPSTUPST-- Technical & Gamma Exposure Analysis
## Current Price Action
- **Current Price**: $53.69 (-$1.79, -3.23%)
- **Range**: High $55.00 / Low $49.90
- **Volume**: 6.39M shares
## Technical Structure
UPST is currently in a significant technical retracement phase after declining sharply from its recent high of $96.43. The stock has formed a descending channelCHRO-- pattern, with multiple rejection points from the 200 and 250-day SMAs during previous rally attempts.
### Key Support Levels:
- **$52.86**: Critical support zone (multiple VWAP Session values align here)
- **$51.50**: Pre-market support level
- **$49.60**: Minor support with volume profile confirmation
- **$40.00**: Major historical support with high volume node
### Key Resistance Levels:
- **$55.00**: Immediate resistance (today's high)
- **$61.53-66.74**: Significant resistance cluster with multiple rejection points
- **$70.18-70.39**: Major resistance zone with prior consolidation
### Volume Profile Analysis
The volume profile indicates significant price acceptance at the $52.86 level, suggesting institutional activity. The negative P/E ratio (-36.699) is adding fundamental pressure, but the stock is approaching a value area on the volume profile where buyers previously showed interest.
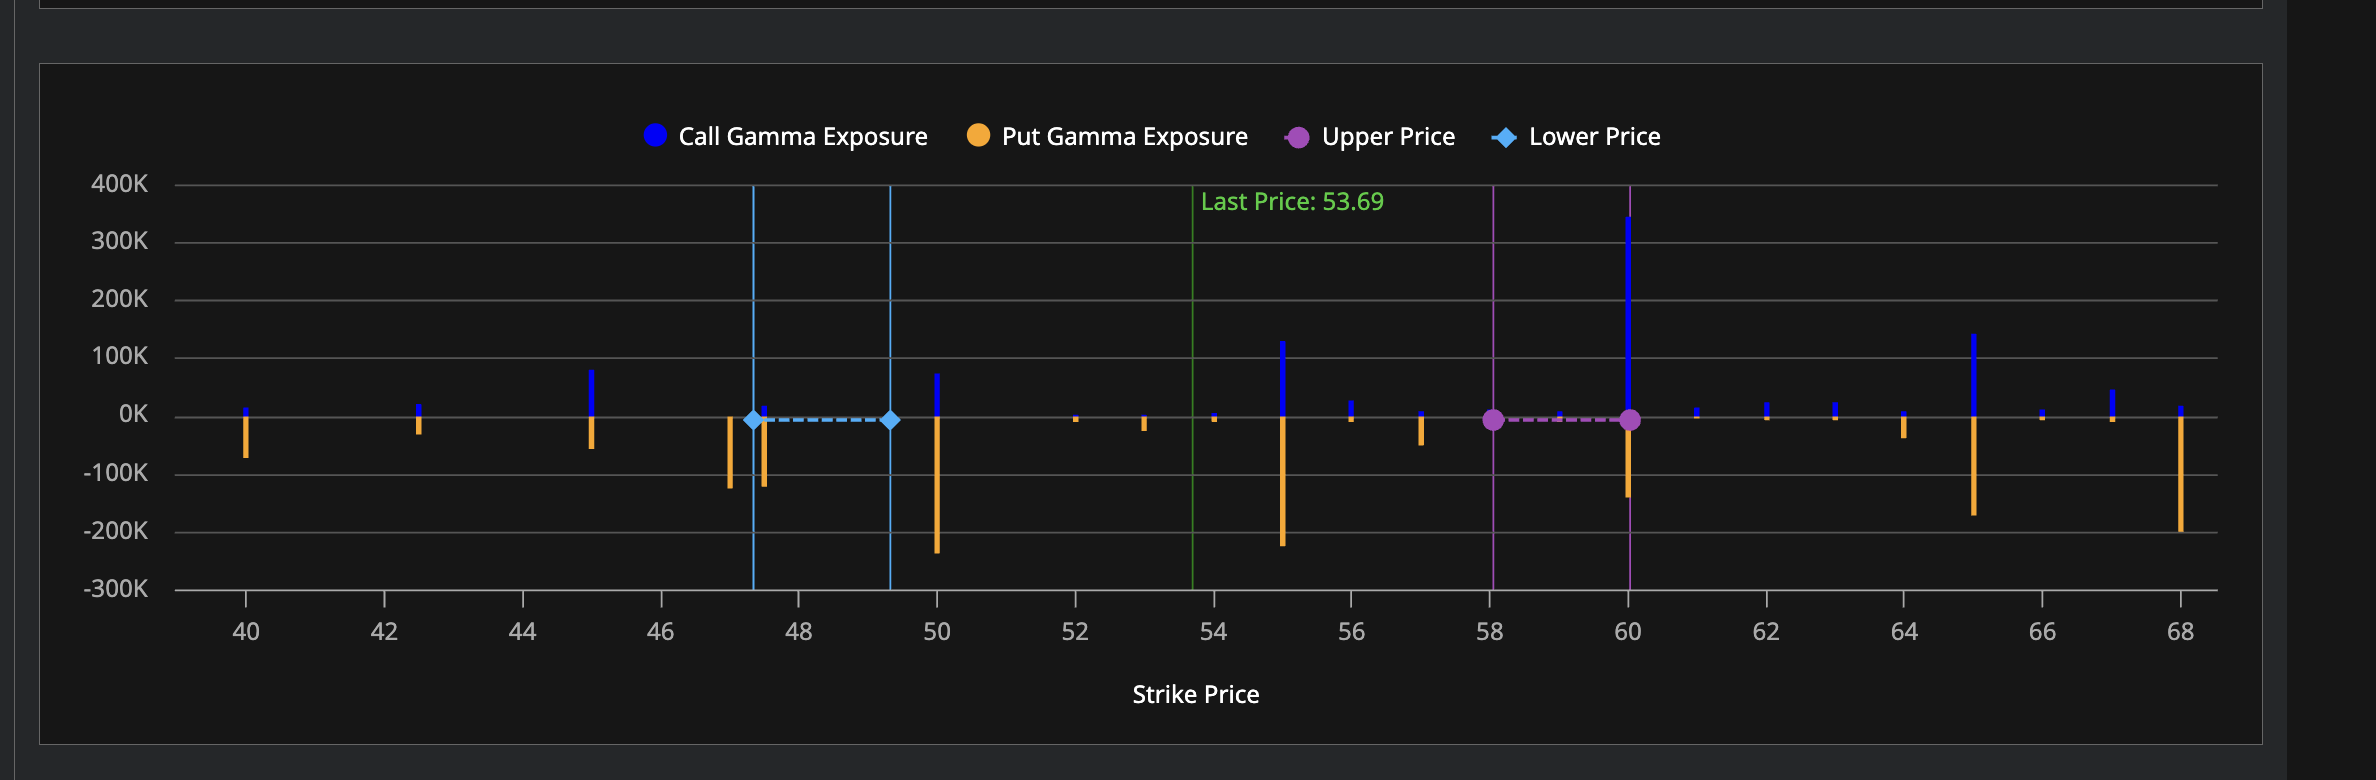
## Gamma Exposure Dynamics
### Call Gamma Concentration
- **$60-61 Strike**: Largest call gamma exposure (>350K contracts)
- **$55-58 Strike**: Moderate call gamma (~100K contracts)
### Put Gamma Concentration
- **$54 Strike**: Heavy put gamma exposure (-250K contracts)
- **$48 Strike**: Secondary put gamma zone (-150K contracts)
- **$64-68 Strike**: Distributed put gamma resistance (-150K to -200K contracts)
### Price Boundaries
- **Upper Price Wall**: $58-60 (purple markers)
- **Lower Price Wall**: $47-48 (blue markers)
## Integrated Technical-Gamma Analysis
The current price of $53.69 sits at a pivotal technical juncture where several forces converge:
1. **Gamma Squeeze Potential**: If UPST breaks above $55.00, market makers will need to hedge call options at the $55-58 strikes, potentially accelerating upward momentum toward the $60-61 gamma wall.
2. **Downside Protection**: The significant put gamma at the $54 strike is creating a "cushion" effect that could slow the current decline, while additional put gamma at $48 forms a stronger floor.
3. **Consolidation Zone**: The interplay between the $52.86 technical support and the $54-55 gamma levels suggests a near-term consolidation zone where price may stabilize.
4. **Volatility Compression**: The narrowing space between upper and lower gamma boundaries indicates a potential volatility squeeze, which often precedes a significant directional move.
## Rule 201 Impact Assessment
Rule 201 (short-sale price test restriction) is active for UPST:
- Short sellers would be limited to selling only on upticks
- This restriction would reduce immediate selling pressure
- The effect would be most pronounced near the $52.86-54.00 zone
- The restriction could provide a temporary floor that aligns with the put gamma support
## Trading Implications
The convergence of technical support at $52.86 with nearby put gamma exposure creates a high-probability inflection pointIPXX--. Market maker hedging activity will likely defend the $53-54 zone due to their put exposure, while simultaneously creating resistance around $58-60 due to their call exposure.
Given the current technical-gamma structure, the highest probability outcome appears to be range-bound price action between $51.50-55.00 in the immediate term, with a potential directional resolution developing once either gamma wall is breached with sufficient volume.

Comentarios
Aún no hay comentarios