
Chainlink (LINK) Technical Resilience and Breakout Potential: A Post-Consolidation Analysis
Chainlink (LINK) has emerged as a focal point in the cryptocurrency market in 2025, with its price action reflecting a complex interplay of technical consolidation and institutional-driven bullish momentum. As the token navigates critical resistance levels, investors and traders are closely monitoring whether LINK can sustain its upward trajectory or face a potential correction. This analysis synthesizes recent technical and fundamental developments to assess Chainlink's breakout potential.
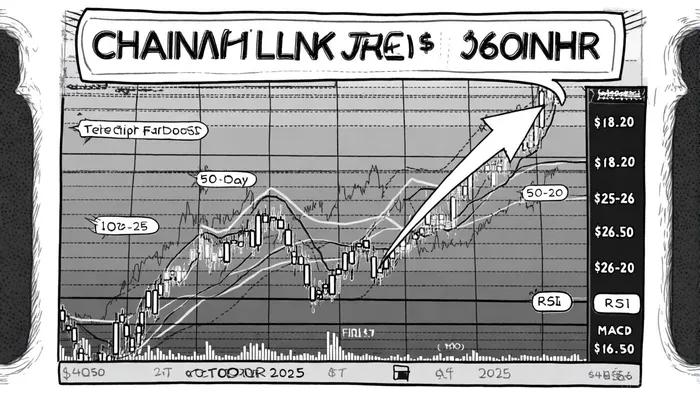
Post-Consolidation Price Action and Key Resistance Levels
Chainlink's price has been consolidating within a descending parallel channel since mid-2025, with the 50-day and 200-day moving averages ($22.11 and $15.91, respectively) acting as dynamic support and trend confirmation tools, according to a Blockchain.News forecast. The most immediate resistance level is currently at $26.03, a threshold that, if breached, could trigger a surge toward $27.88 by October 2025, as noted in an Invezz article. Analysts from Blockchain.News note that a successful breakout above $26.03 would confirm the end of a corrective phase and initiate a new upward wave, potentially targeting $30–$32, a view echoed elsewhere in the market.
Historical data from Gate.com highlights $18.20 as a foundational resistance level, with a breakout expected to drive bullish momentum in the short term in a Gate.com analysis. However, the path to $26.50-a critical juncture identified by CoinCheckup-is not without challenges. A breakdown below $20.03 could expose the price to deeper retracements at $16.98 and $13.81, underscoring the volatility inherent in the asset class, as previously reported by Blockchain.News.
Technical Indicators and Momentum Signals
Technical indicators paint a mixed but cautiously optimistic picture. The Relative Strength Index (RSI) currently sits at 64.84, indicating balanced market sentiment, while the MACD histogram shows a bullish cross and is emerging from a bearish divergence trend, signaling potential for a near-term breakout, according to a CCN technical analysis. The narrowing Bollinger Bands suggest an impending period of volatility, which could either accelerate the price toward $27.88 or trigger a pullback, as discussed in a Currency Analytics piece.
Notably, the MACD Golden Cross-a key bullish signal-has historically shown limited alpha-generating potential for LINK. A backtest of buying LINK on MACD Golden Cross events and holding for 30 trading days from 2022 to 2025 revealed a mean return of +2.68%, slightly trailing the +3.05% buy-and-hold benchmark over the same windows. With a win rate below 50% and no statistically significant excess returns, the strategy did not consistently outperform a passive position in LINK during the study period, according to a MACD backtest.
On-chain data further reinforces bullish sentiment. Whale activity and the launch of a strategic LINK reserve have bolstered investor confidence, with Invezz noting that LINK's integration into BNBBNB-- Chain's oracle infrastructure has expanded its utility in real-world economic data applications. This institutional adoption aligns with broader trends in decentralized finance (DeFi) and real-world asset (RWA) tokenization, providing a fundamental underpinning for technical gains.
Fundamental Catalysts and Institutional Adoption
Chainlink's ecosystem has seen significant growth in 2025, with strategic integrations into platforms like ApeChain, AvalancheAVAX--, and Solana's Kamino FinanceKMNO--, as covered by The Currency Analytics. These partnerships have increased organic demand for LINK, particularly in oracle-driven smart contracts and cross-chain data verification. Additionally, the U.S. Department of Commerce collaboration and Mastercard's adoption of ChainlinkLINK-- oracles have enhanced its credibility in traditional finance circles, further supporting the bullish narrative.
The Grayscale ETF filing and growing institutional interest in oracle infrastructure further amplify bullish narratives. As market commentators highlight, the formation of a bull flag pattern on the weekly chart, with resistance at $25–$26, suggests a potential parabolic rally if the $100 price target is validated.
Risk Factors and Bearish Scenarios
Despite the bullish technical setup, risks remain. A failure to break above $26.50 could lead to a retest of the $20.03 support level, with further downside risks to $18.08 and $13.81, as previously discussed by Currency Analytics. CoinCodex analysts caution that a drop to $16.48 by late 2025 is plausible if on-chain outflows persist, a scenario also noted in Blockchain.News. Traders are advised to monitor these levels closely, as a breakdown could invalidate the current bullish momentum.
Conclusion
Chainlink (LINK) stands at a pivotal juncture in October 2025, with its technical resilience and institutional adoption creating a compelling case for a breakout. While key resistance levels at $26.03 and $26.50 remain critical, the convergence of bullish indicators, strategic integrations, and growing institutional demand positions LINK as a high-conviction asset for the remainder of the year. Investors should balance optimism with caution, using stop-loss strategies below key support levels to mitigate downside risks.


Comentarios
Aún no hay comentarios