
Chainlink (LINK): Critical Technical Levels and Market Dynamics at a Pivotal Juncture
Chainlink (LINK) has reached a pivotal juncture in its price trajectory, with technical indicators and market dynamics aligning to signal both opportunity and risk for investors. As of August 27, 2025, the token closed at $23.76, having fluctuated between $23.60 and $25.90 during the day [1]. This price action reflects a complex interplay of bullish fundamentals and bearish short-term pressures, creating a critical inflection point for strategic investment decisions.
Technical Indicators and Market Sentiment
The Relative Strength Index (RSI) for ChainlinkLINK-- stands at 53.79, indicating a neutral position between overbought and oversold conditions [4]. Meanwhile, the MACD histogram has turned negative (-0.27), signaling weakening bullish momentum in the short term [4]. These mixed signals suggest that while the broader trend remains constructive, immediate volatility could test key support and resistance levels.
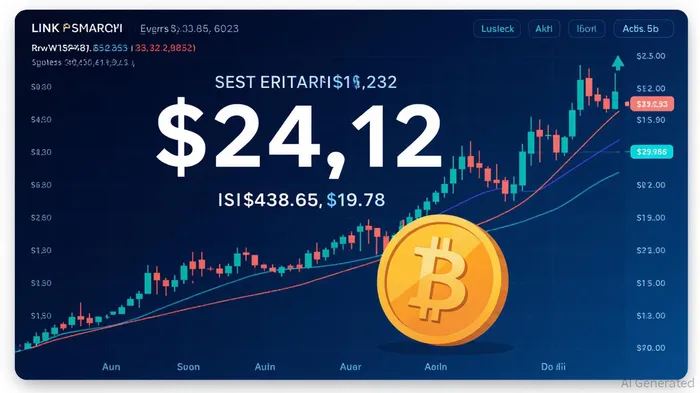
Chainlink’s price has held above the 1.618 Fibonacci extension at $23.69, a critical psychological barrier [4]. A breakout above $27.87—a level aligned with the 52-week high and a multi-year resistance zone—could validate a long-term bullish trend, potentially propelling the price toward $30–$35 [1]. Conversely, a breakdown below $19.78 support could trigger a retest of the 200-day EMA at $17.02, exposing deeper vulnerabilities in the market structure [3].
Whale Activity and Institutional Adoption
On-chain data reveals significant whale-driven liquidity shifts, with $10.2 million withdrawn from Binance and 9,813 active wallets indicating reduced selling pressure [3]. These movements suggest accumulation by long-term holders, reinforcing the narrative of sustained bullish conviction. Additionally, strategic partnerships with institutions like SolanaSOL-- and J.P. Morgan have driven a 121% surge in trading volume post-Q2 updates [1], underscoring Chainlink’s role as a bridge between blockchain and traditional finance.
Strategic Investment Timing
For investors, the current setup offers a favorable risk-reward profile. Aggressive positions might target the $27.87 resistance level, with a potential 13.39% gain projected for August 2025 [3]. Conservative strategies could wait for a pullback to the $22–$23 range, where the 30-day SMA at $21.51 acts as dynamic support [4]. However, caution is warranted if the price fails to hold above $24.84, as this could reignite bearish sentiment and trigger a deeper correction [4].
The broader crypto market’s cautious tone—reflected in a 0.93% decline in altcoins and a Fear & Greed Index of 43—adds complexity to Chainlink’s outlook [4]. While institutional adoption and real-world asset (RWA) integrations provide long-term tailwinds, short-term volatility remains a key risk.
Conclusion
Chainlink’s current price action and technical configuration present a compelling case for strategic entry, provided investors align their timing with key resistance and support levels. A breakout above $27.87 would signal a resumption of the bullish trend, while a breakdown below $19.78 could necessitate a reassessment of risk. Given the interplay of on-chain strength, institutional validation, and technical dynamics, Chainlink remains a critical asset to monitor in the evolving crypto landscape.
**Source:[1] Chainlink USD (LINK-USD) Price History & Historical Data
https://finance.yahoo.com/quote/LINK-USD/history/[2] Chainlink Historical Data
https://www.investing.com/crypto/chainlink/historical-data[3] Chainlink (LINK): Is $30 the Next Milestone as Bullish...
https://www.ainvest.com/news/chainlink-link-30-milestone-bullish-fundamentals-technical-indicators-align-2508/[4] Latest Chainlink (LINK) Price Analysis
https://coinmarketcap.com/cmc-ai/chainlink/price-analysis/


Comentarios
Aún no hay comentarios