
Century Communities' 15min chart triggers MACD Death Cross, Bollinger Bands Narrowing.
PorAinvest
lunes, 10 de marzo de 2025, 11:28 am ET1 min de lectura
CCS--
The MACD indicator, developed by Gerald Appel in the late 1970s, is a trend-following momentum oscillator that converts two moving averages into a single, momentum-based indicator [1]. The MACD line is calculated by subtracting the 26-day Exponential Moving Average (EMA) from the 12-day EMA [1]. A Death Cross occurs when the MACD line crosses below its signal line, which is a 9-day EMA of the MACD line [1]. This signal typically indicates a bearish trend and potential sell opportunities.
The narrowing Bollinger Bands, which measure a stock's volatility, further support the potential decline in Century Communities' stock price. Bollinger Bands consist of a moving average and two standard deviations plotted above and below the moving average [1]. When the Bollinger Bands narrow, it suggests that the stock's price movements are becoming less volatile, potentially indicating a trending market.
Century Communities' stock price has experienced a downtrend since early February 2025, declining from a high of $52.50 to a low of $43.80 on March 10, 2025 [2]. The Death Cross and narrowing Bollinger Bands suggest that this downtrend may continue, potentially with decreasing fluctuations in magnitude. However, it is essential to consider that technical indicators should not be the sole basis for investment decisions and should be used in conjunction with other fundamental and qualitative analysis.
[1] ChartSchool. (n.d.). MACD Moving Average Convergence Divergence Oscillator. Retrieved March 12, 2025, from https://chartschool.stockcharts.com/table-of-contents/technical-indicators-and-overlays/technical-indicators/macd-moving-average-convergence-divergence-oscillator
[2] Yahoo Finance. (n.d.). Century Communities, Inc. (CCS) Stock Price, News, & Analysis. Retrieved March 12, 2025, from https://finance.yahoo.com/quote/CCS/history?p=CCS
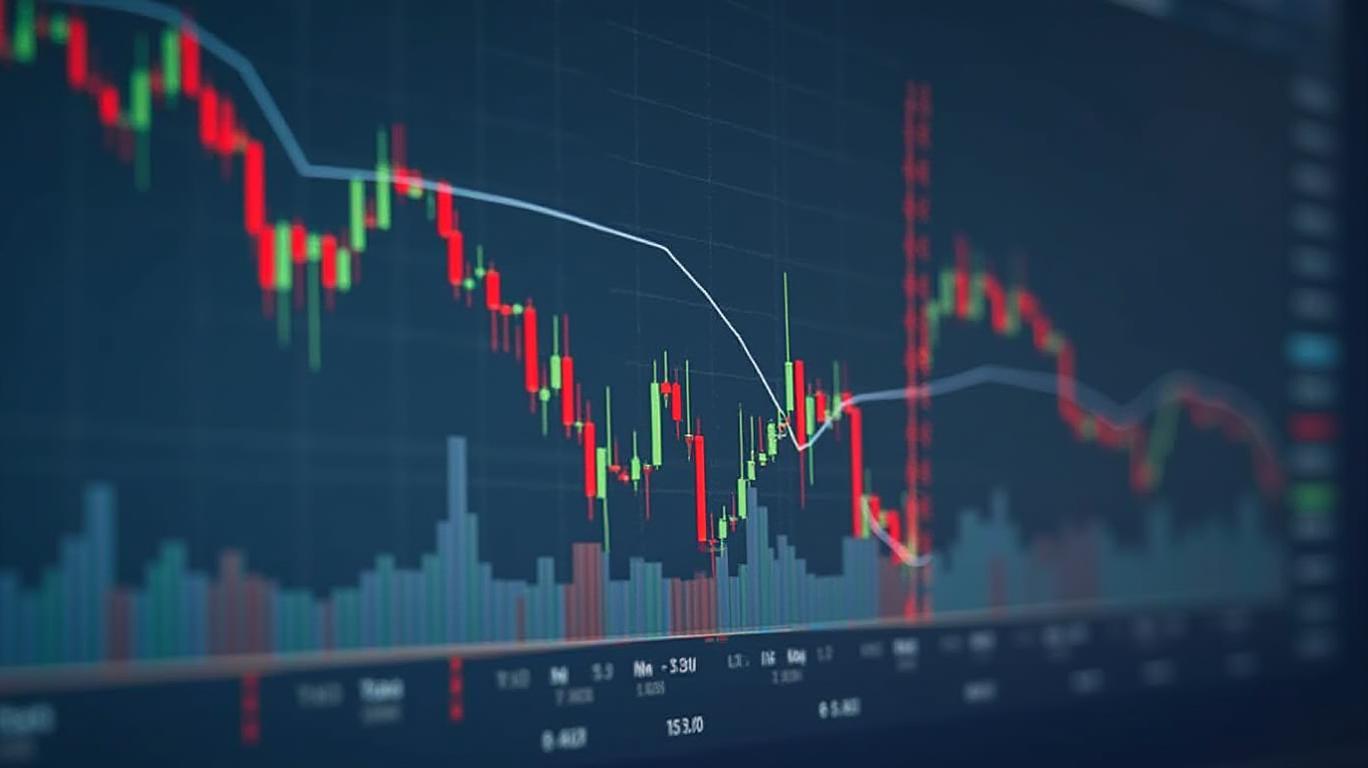
According to the 15-minute chart of Century Communities, the Moving Average Convergence Divergence (MACD) indicator has recently triggered a Death Cross, while the Bollinger Bands have narrowed to a significant degree on March 10, 2025, at 11:15. This suggests that the stock price may continue to decline, with the magnitude of these fluctuations potentially decreasing.
Century Communities, Inc. (NYSE: CCS), a leading homebuilder, experienced a notable shift in its technical chart on March 10, 2025. According to the 15-minute chart, the Moving Average Convergence Divergence (MACD) indicator, a popular momentum indicator, triggered a Death Cross, while the Bollinger Bands narrowed significantly [1]. These developments suggest that the stock price may continue to decline, potentially with decreasing fluctuations in magnitude.The MACD indicator, developed by Gerald Appel in the late 1970s, is a trend-following momentum oscillator that converts two moving averages into a single, momentum-based indicator [1]. The MACD line is calculated by subtracting the 26-day Exponential Moving Average (EMA) from the 12-day EMA [1]. A Death Cross occurs when the MACD line crosses below its signal line, which is a 9-day EMA of the MACD line [1]. This signal typically indicates a bearish trend and potential sell opportunities.
The narrowing Bollinger Bands, which measure a stock's volatility, further support the potential decline in Century Communities' stock price. Bollinger Bands consist of a moving average and two standard deviations plotted above and below the moving average [1]. When the Bollinger Bands narrow, it suggests that the stock's price movements are becoming less volatile, potentially indicating a trending market.
Century Communities' stock price has experienced a downtrend since early February 2025, declining from a high of $52.50 to a low of $43.80 on March 10, 2025 [2]. The Death Cross and narrowing Bollinger Bands suggest that this downtrend may continue, potentially with decreasing fluctuations in magnitude. However, it is essential to consider that technical indicators should not be the sole basis for investment decisions and should be used in conjunction with other fundamental and qualitative analysis.
[1] ChartSchool. (n.d.). MACD Moving Average Convergence Divergence Oscillator. Retrieved March 12, 2025, from https://chartschool.stockcharts.com/table-of-contents/technical-indicators-and-overlays/technical-indicators/macd-moving-average-convergence-divergence-oscillator
[2] Yahoo Finance. (n.d.). Century Communities, Inc. (CCS) Stock Price, News, & Analysis. Retrieved March 12, 2025, from https://finance.yahoo.com/quote/CCS/history?p=CCS
Divulgación editorial y transparencia de la IA: Ainvest News utiliza tecnología avanzada de Modelos de Lenguaje Largo (LLM) para sintetizar y analizar datos de mercado en tiempo real. Para garantizar los más altos estándares de integridad, cada artículo se somete a un riguroso proceso de verificación con participación humana.
Mientras la IA asiste en el procesamiento de datos y la redacción inicial, un miembro editorial profesional de Ainvest revisa, verifica y aprueba de forma independiente todo el contenido para garantizar su precisión y cumplimiento con los estándares editoriales de Ainvest Fintech Inc. Esta supervisión humana está diseñada para mitigar las alucinaciones de la IA y garantizar el contexto financiero.
Advertencia sobre inversiones: Este contenido se proporciona únicamente con fines informativos y no constituye asesoramiento profesional de inversión, legal o financiero. Los mercados conllevan riesgos inherentes. Se recomienda a los usuarios que realicen una investigación independiente o consulten a un asesor financiero certificado antes de tomar cualquier decisión. Ainvest Fintech Inc. se exime de toda responsabilidad por las acciones tomadas con base en esta información. ¿Encontró un error? Reportar un problema

SOBRE NOSOTROS
Nuestra historiaAutores de noticiasBase de conocimientosPolítica de privacidadTérmino de usoDescargo de responsabilidad de corretaje de tercerosTérminos de uso de AIMEDivulgaciones de riesgos de AInvest AICarrerasCONTÁCTENOS
Email: support@ainvest.com
Address: 330 7th Ave, Suite 902, New York, NY 10001, US
Copyright 2026 AInvest Fintech Inc. All rights reserved.
Comentarios
Aún no hay comentarios