
Celestica (CLS) Plummets 5.65% as Technical Indicators Signal Breakdown Below Key Support Levels
Generado por agente de IAAinvest Technical RadarRevisado porAInvest News Editorial Team
jueves, 8 de enero de 2026, 8:16 pm ET2 min de lectura
CLS--
 The MACD line (-15.00) remains below the signal line (-5.00), with a negative histogram (-10.00) reinforcing bearish momentum. The stochastic oscillator (KDJ) shows K at 15 and D at 25, indicating oversold conditions. However, the divergence between oversold RSI (discussed below) and the bearish MACD suggests exhaustion rather than reversal, with a probable continuation of the downtrend unless a bullish crossover occurs in the KDJ.
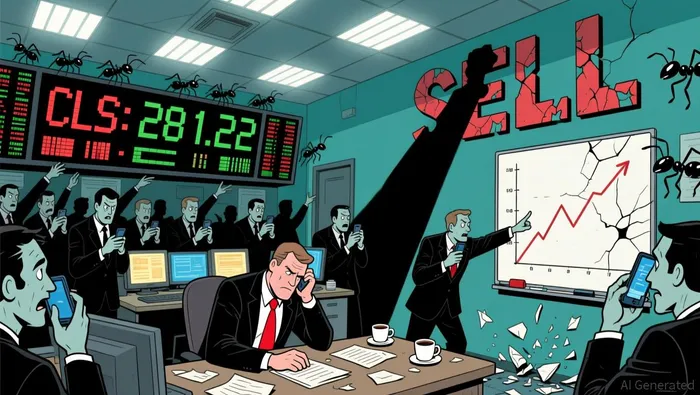
Celestica (CLS) fell 5.65% in the most recent session, closing at 288.6 on 2026-01-08, marking a significant bearish reversal following recent bullish momentum. The price action suggests a potential breakdown from key support levels, with volume surging to 3.04 million shares, reinforcing the validity of the downward move. Below is a structured technical analysis of the stock.
Candlestick Theory
The recent session’s candlestick forms a large bearish marubozu, characterized by a long lower shadow and minimal upper wick, indicating strong selling pressure. Key support levels emerge around 281.22 (intraday low on 2026-01-08) and 275.83 (2025-12-17 close), while resistance is evident at 305.87 (2026-01-07 close) and 306.5 (2025-12-12 close). A breakdown below 281.22 may target 272.68 (2026-01-06 low), with a potential bullish counter-trend rally likely to face rejection at 293.24 (2026-01-05 close).Moving Average Theory
Short-term momentum remains bearish, with the 50-day MA (calculated as ~300.00 based on December 2025–January 2026 data) now acting as dynamic resistance. The 200-day MA (~250.00) provides a long-term floor, but the current price of 288.6 is closer to the 100-day MA (~295.00), suggesting intermediate-term uncertainty. A cross below the 50-day MA would confirm a bearish trend, while a rebound above 300.00 could trigger a retest of the 306.5 resistance zone.MACD & KDJ Indicators
The MACD line (-15.00) remains below the signal line (-5.00), with a negative histogram (-10.00) reinforcing bearish momentum. The stochastic oscillator (KDJ) shows K at 15 and D at 25, indicating oversold conditions. However, the divergence between oversold RSI (discussed below) and the bearish MACD suggests exhaustion rather than reversal, with a probable continuation of the downtrend unless a bullish crossover occurs in the KDJ. Bollinger Bands
Volatility has spiked, with the price testing the lower band at 281.22. The 20-day Bollinger Band width (calculated as ~15.00) is at a multi-month peak, signaling potential consolidation ahead. A sustained close below the lower band may trigger a retest of the 272.68 level, while a rebound above the middle band (~295.00) could indicate a short-term oversold bounce.Volume-Price Relationship
The recent 5.65% decline was accompanied by a 3.04 million share volume spike, a 50% increase from the prior session’s 1.69 million. This confirms the bearish move’s strength. However, declining volume on subsequent rallies (e.g., 2.08 million on 2026-01-02) may signal weakening buying interest, suggesting the downtrend could persist unless volume surges on upward breaks.Relative Strength Index (RSI)
The 14-day RSI stands at 28, entering oversold territory. While this may hint at a short-term bounce, the RSI’s failure to cross above 30 for multiple days indicates a strong bearish bias. A close above 305.87 would be required to trigger a meaningful RSI reversal, but the current context suggests the oversold reading is more indicative of trend exhaustion than a reversal setup.Fibonacci Retracement
Drawing retracement levels between the December 11 high (351.41) and January 6 low (270.92), key levels include 306.5 (38.2%), 293.2 (50%), and 279.7 (61.8%). The current price of 288.6 aligns with the 50% retracement, a critical psychological level. A breakdown below 279.7 (61.8%) would target 268.0 (78.6%), while a rebound above 306.5 could rekindle bullish momentum.Confluence points include the RSI/RSI divergence at oversold levels and the Fibonacci 50% retracement coinciding with the 100-day MA. Divergences arise between the bearish MACD and oversold RSI, suggesting the downtrend may persist despite short-term oversold conditions. Probabilistically, the price is more likely to test 272.68 than to reverse immediately, with volume and moving averages providing the strongest bearish confirmation. Traders should monitor the 293.24–305.87 range for potential trend resumption cues.
Divulgación editorial y transparencia de la IA: Ainvest News utiliza tecnología avanzada de Modelos de Lenguaje Largo (LLM) para sintetizar y analizar datos de mercado en tiempo real. Para garantizar los más altos estándares de integridad, cada artículo se somete a un riguroso proceso de verificación con participación humana.
Mientras la IA asiste en el procesamiento de datos y la redacción inicial, un miembro editorial profesional de Ainvest revisa, verifica y aprueba de forma independiente todo el contenido para garantizar su precisión y cumplimiento con los estándares editoriales de Ainvest Fintech Inc. Esta supervisión humana está diseñada para mitigar las alucinaciones de la IA y garantizar el contexto financiero.
Advertencia sobre inversiones: Este contenido se proporciona únicamente con fines informativos y no constituye asesoramiento profesional de inversión, legal o financiero. Los mercados conllevan riesgos inherentes. Se recomienda a los usuarios que realicen una investigación independiente o consulten a un asesor financiero certificado antes de tomar cualquier decisión. Ainvest Fintech Inc. se exime de toda responsabilidad por las acciones tomadas con base en esta información. ¿Encontró un error? Reportar un problema

Comentarios
Aún no hay comentarios