
CarMax (KMX) Q2 2025 Earnings: What Investors Should Watch for in Inventory Turn, Pricing Power, and Used Vehicle Demand
In Q2 2025, CarMaxKMX-- (KMX) delivered a mixed performance, showcasing resilience in core retail operations while grappling with headwinds in its financing division. For investors, the key metrics—inventory turnover, pricing power, and used vehicle demand—reveal a company recalibrating its strategy to navigate macroeconomic pressures and shifting consumer preferences.
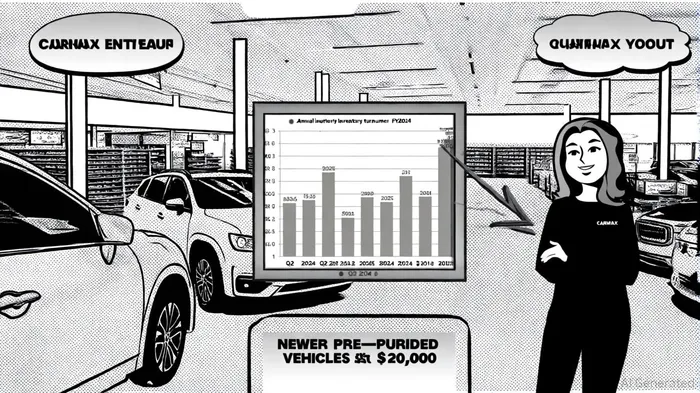
Inventory Turnover: Efficiency Amid Strategic Shifts
CarMax's inventory turnover ratio for Q2 2025 stood at 1.84, a marginal improvement from Q2 2024's 1.75[2]. While this quarterly figure remains lower than its annual FY2024 average of 5.96[4], the company has strategically adjusted its inventory mix to align with market dynamics. According to a report by CarMax's investor relations team, the retailer is now prioritizing newer pre-owned vehicles priced under $20,000 and aged 6–10 years, a shift driven by U.S. tariffs on imported cars and growing demand for affordable, tech-equipped models[1]. This recalibration aims to reduce holding costs and accelerate turnover, though investors should monitor whether the focus on lower-priced inventory could compress margins in the long term.
Pricing Power: No-Haggle Model and AI-Driven Optimization
CarMax's no-haggle pricing strategy continues to differentiate it in a fragmented market. The company's rigorous 125-point vehicle inspection process[3] and transparent pricing model have historically bolstered consumer trust, enabling it to command premium gross profits. In Q2 2025, gross profit per retail used unit hit a record $2,407, up $60 year-over-year[5]. This success is partly attributed to the company's investment in artificial intelligence and data analytics, which optimize pricing and inventory management[5]. However, the effectiveness of these tools will be tested as economic uncertainty persists and competitors adopt similar technologies.
Used Vehicle Demand: Robust Sales, but Risks Loom
Retail used unit sales surged 9.0% year-over-year, with comparable store sales up 8.1%[5], underscoring strong consumer demand for pre-owned vehicles. CarMax acquired 300,000 used vehicles in Q2 2025, a 2.9% increase from the prior year[1], reflecting its ability to scale supply chains amid inflationary pressures. Yet, the company's focus on vehicles under $20,000—while prudent—could expose it to margin compression if new vehicle prices remain elevated. Additionally, the 25.2% increase in provision for loan losses at CarMax Auto Finance (CAF) to $101.7 million[5] signals deteriorating credit quality, a risk that could dampen profitability if economic conditions worsen.
Strategic Positioning and Investor Implications
CarMax's operational strengths—efficient inventory management, pricing discipline, and a robust service margin—position it well in a market where traditional dealers struggle with haggling and inconsistent quality. However, the company's reliance on macroeconomic stability and its exposure to CAF's credit risks necessitate caution. Investors should watch for:
1. Inventory turnover trends as the new vehicle strategy matures.
2. AI-driven margin optimization in pricing and cost control.
3. Credit quality metrics at CAF, particularly as interest rates and unemployment rates evolve.
Moreover, historical backtesting of KMX's earnings events from 2022 to 2025 reveals that a simple buy-and-hold strategy has shown a positive cumulative excess return of +3.2% by day 30, with a 60% win rate, suggesting potential post-earnings momentum. This indicates that while immediate reactions may be neutral, investors might consider holding positions beyond the initial earnings response to capture longer-term gains.

Comentarios
Aún no hay comentarios