
Carlyle Group's 8.32% 2-Day Rally Driven by Bullish Technical Signals and Golden Cross
The Carlyle Group (CG) has surged 5.21% in the most recent session, extending its two-day rally to an 8.32% gain. This sharp move suggests a potential short-term reversal or continuation pattern, warranting a detailed technical analysis across multiple frameworks. Below is a structured evaluation of key technical indicators, with an emphasis on confluence and divergences.
Candlestick Theory 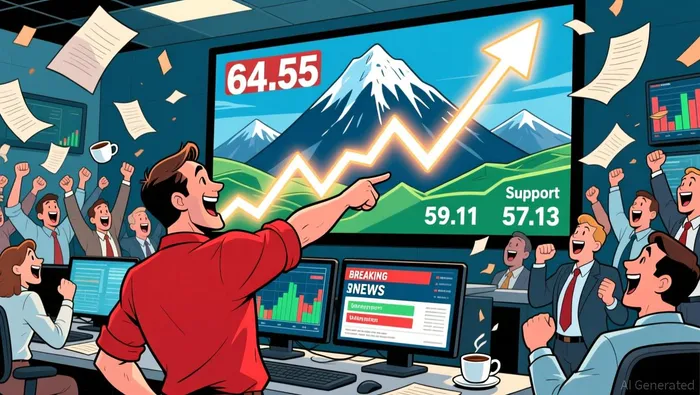 The recent price action forms a bullish engulfing pattern, with the two-day rally surpassing prior resistance levels. Key support levels are evident at $59.11 (Dec 31 low) and $57.13 (Dec 15 low), while resistance is reinforced at $64.55 (Jan 5 high). A break above $64.55 may indicate a continuation of the uptrend, whereas a retest of $59.11 could validate its role as a dynamic support. The absence of bearish reversal patterns like dark cloud covers or evening stars suggests the bullish momentum remains intact.
Moving Average Theory
The 50-day, 100-day, and 200-day moving averages, calculated from historical data, indicate a bullish bias. The 50-day MA (approx. $58.50) is above the 200-day MA (approx. $54.00), forming a "golden cross" backdrop. The current price of $64.03 sits well above all three averages, confirming a strong uptrend. However, the 100-day MA (~$60.00) may act as a near-term resistance if the rally stalls. Confluence between the 50-day MA and Fibonacci retracement levels could amplify the significance of these thresholds.
MACD & KDJ Indicators
The MACD histogram has turned positive, with the line crossing above the signal line, signaling growing bullish momentum. The KDJ indicator shows the stochastic %K at 85 and %D at 75, suggesting overbought conditions. While this may imply a short-term pullback risk, the alignment of MACD and the price’s distance from oversold territory (KDJ below 20) suggests the uptrend remains robust. A divergence between the KDJ and price action could signal weakening momentum, but no such divergence is currently evident.
Bollinger Bands
Volatility has expanded, with the bands widening from a recent contraction phase. The price currently resides near the upper band, reinforcing the strength of the uptrend. A sustained move above the upper band may indicate a breakout, while a retest of the lower band (~$57.00) could act as a critical support. The bands’ expansion aligns with the MACD’s bullish signal, creating a confluence of momentum and volatility-driven optimism.
Volume-Price Relationship
Trading volume has surged in the past two sessions, with the most recent day’s volume (2.1 million shares) exceeding the 30-day average. This validates the sustainability of the price rally. However, if volume tapers while the price continues upward, it may signal a potential exhaustion of buying pressure. The positive correlation between volume and price action currently supports the view that the move is driven by genuine demand rather than a short-covering rally.
Relative Strength Index (RSI)
The 14-day RSI is in overbought territory (~75), consistent with the KDJ’s overbought signal. While this typically warns of a possible correction, the RSI’s trajectory remains above 70, indicating strong conviction in the uptrend. A drop below 70 would suggest a pullback, but a sustained move above 70 may indicate a continuation. Caution is warranted if the RSI forms a bearish divergence (e.g., lower highs with higher price highs).
Fibonacci Retracement
Applying Fibonacci levels between the 52-week low (~$41.00) and recent high (~$64.55), key retracement levels are at $54.15 (38.2%), $57.13 (50%), and $59.64 (61.8%). The current price of $64.03 is approaching the 23.6% retracement level (~$61.80), which may act as a near-term resistance. A break above this level would target the 50% retracement at $57.13 as dynamic support. Confluence between Fibonacci levels and moving averages (e.g., 50-day MA) further strengthens the significance of these thresholds.
In summary, The Carlyle Group’s recent price action is supported by bullish candlestick patterns, a strong moving average alignment, and expanding Bollinger Bands. The overbought RSI and KDJ suggest caution for short-term pullbacks, but the confluence of momentum indicators and volume validates the uptrend’s sustainability. Key watchpoints include the $64.55 resistance, $59.11 support, and potential divergences between RSI and price. Traders should monitor volume patterns and Fibonacci levels for confirmation of trend continuation or reversal.

Comentarios
Aún no hay comentarios