
Cardano's Path to $1: A Technical and Fundamental Analysis
Cardano (ADA) is at a pivotal juncture in its journey toward $1. A confluence of technical indicators, on-chain metrics, and institutional adoption catalysts suggests the asset is primed for a breakout. This analysis dissects the interplay between Cardano's price action and the structural forces driving its long-term potential.
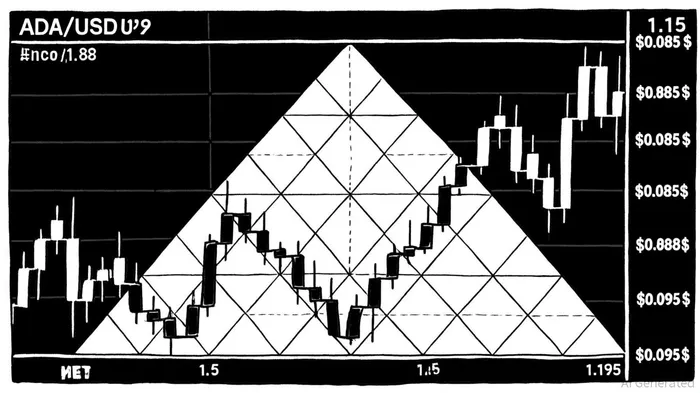
Technical Setup: Symmetrical Triangle and Bullish Momentum
ADA's price action has formed a symmetrical triangle pattern, a classic consolidation structure that often precedes a directional breakout. Key support levels are currently anchored at $0.85–$0.88, while resistance clusters between $0.95–$0.98[1]. A clean break above the critical $1.15 threshold could trigger a sustained bullish trend, with price targets extending to $1.10 or higher[1].
On-chain data reinforces this narrative. Over 15 billion ADA tokens have remained dormant for more than a year, signaling strong investor conviction and reduced sell pressure[1]. Meanwhile, technical indicators like the RSI, MACD, and Bollinger Bands all point to bullish momentum, with short-term price targets between $1.05–$1.18[1]. Historical patterns also suggest ADAADA-- could replicate past breakout scenarios, such as the 240% surge that pushed the price toward $2.60[2].
Prediction markets further amplify the optimism, assigning a 76% probability of ADA reaching $1 by year-end[2]. This probabilistic edge, combined with the triangle pattern's high-reward setup, makes ADA a compelling case study in technical analysis.
Institutional Adoption: Catalysts for Legitimacy and Liquidity
While technicals set the stage, institutional adoption is the engine driving Cardano's long-term value proposition. Grayscale's inclusion of ADA in its Smart Contract Platform Ex-Economy Fund—allocating 20% of its holdings to the asset—signals robust institutional confidence[4]. This follows the U.S. government's landmark decision to include CardanoADA-- in a national digital asset reserve, a move that validated its strategic importance alongside BitcoinBTC--, EthereumETH--, and Solana[2].
Regulatory developments are equally transformative. The Grayscale Cardano ETF filing, delayed to October 26, 2025, remains a critical catalyst[5]. Despite the SEC's cautious timeline, analysts now assign an 87% approval probability after Grayscale's amended S-1 filing[5]. An ETF approval would notNOT-- only provide regulated exposure for traditional investors but also de-risk ADA's classification as a “security,” unlocking broader institutional participation[3].
Cardano's technological upgrades further solidify its appeal. The Hydra scaling solution has achieved 100,000 TPS, while the Mithril upgrade enhances lightweight node verification[1]. These innovations, coupled with partnerships like the Tokeo Wallet integration with XRP Ledger and collaborations with FC Barcelona, underscore Cardano's real-world utility[4].
DeFi Growth and Network Effects
Cardano's decentralized finance (DeFi) ecosystem has seen a 35% surge in TVL, now valued at $349 million, driven by platforms like Liqwid Finance[2]. This growth is underpinned by Cardano's research-driven development model and energy-efficient Ouroboros consensus, which appeal to institutions prioritizing security and sustainability[3].
Meanwhile, the network's user base has expanded to 5.5 million wallets, reflecting growing adoption and trust[1]. With 1,985 active projects and 10.68 million native tokens issued, Cardano's ecosystem is maturing into a robust infrastructure for enterprise blockchain solutions[1].
Conclusion: A Confluence of Forces
Cardano's path to $1 hinges on a perfect storm of technical readiness and institutional validation. The symmetrical triangle pattern offers a high-probability breakout scenario, while on-chain metrics and regulatory progress suggest a favorable environment for sustained growth. If the Grayscale ETF is approved, ADA could see a liquidity surge that accelerates its ascent toward—and beyond—$1.
For investors, the key takeaway is clear: Cardano is not just a technical play but a structural bet on the convergence of blockchain innovation and institutional finance. However, historical backtests of similar breakout patterns since 2022 reveal a mixed risk profile. While the model showed an annualized return of ~22%, cumulative returns were negative (-18.6%) due to concentrated gains and frequent false breakouts[1]. An 80% historical drawdown during bear phases underscores the need for disciplined risk management, such as stop-loss/take-profit bands or trend filters[1].


Comentarios
Aún no hay comentarios