
Blackstone Rises 3.83% to $165.92 as Bullish Technicals Signal Upside Momentum
Generado por agente de IAAinvest Technical Radar
miércoles, 16 de julio de 2025, 7:00 pm ET2 min de lectura
BX--
Blackstone (BX) rose 3.83% to $165.92 in the latest session, recovering from the prior day's drop and trading near recent highs. The comprehensive technical analysis below examines key indicators and patterns.
Candlestick Theory
Recent candlesticks show a bullish reversal pattern emerging after a pullback. The July 16 session formed a robust green candle closing near its high ($166.72), erasing the previous red candle’s losses and suggesting renewed buying pressure. Key support holds at $159.80 (July 15 low) and $158.69 (July 10 low), while resistance is evident at $166.72 (current high) and $167.98 (February peak). A sustained break above $167 would signal bullish continuation.
Moving Average Theory
The 50-day moving average (~$152) has acted as dynamic support during June-July pullbacks, with price consistently rebounding above it. The 100-day MA ($145) and 200-day MA ($139) slope upward, confirming the primary uptrend. The current price trades above all three averages, and the 50/100-day golden cross in late June reinforces bullish momentum. This alignment suggests underlying strength, though extended deviations may invite near-term consolidation.
MACD & KDJ Indicators
MACD shows bullish momentum resurfacing: the histogram turned positive on July 16 as the MACD line crossed above the signal line. Concurrently, KDJ exited oversold territory (KDJ=25 on July 15) and now points upward with %K at 65 and %D at 55, indicating accelerating upside momentum. However, both oscillators remain below overbought thresholds, leaving room for further gains before signaling exhaustion.
Bollinger Bands
Volatility expanded notably during the July 10 surge, with price challenging the upper band ($167). The bands subsequently narrowed during consolidation, culminating in the July 16 breakout. Price now trades near the upper band (~$168), reflecting bullish momentum. A sustained move outside the band may suggest overextension, but the expansion phase supports upside continuation if volume persists.
Volume-Price Relationship
Volume surged 42% to 5.66M shares on July 16, validating the bullish breakout and signaling strong institutional participation. Earlier sell-offs (e.g., July 14–15) occurred on below-average volume, undermining their bearish significance. The July 10 advance similarly saw high volume (5.58M shares), confirming accumulation. Volume patterns align with bullish price action, suggesting sustainable upside momentum.
Relative Strength Index (RSI)
The 14-day RSI (58) has rebounded from near-neutral levels but remains below overbought territory. This indicates moderate upward momentum without immediate exhaustion risks. RSI’s recovery from oversold conditions in late June preceded the current rally. While divergence occurred in July when price made higher highs as RSI marginally declined, this has now resolved bullishly.
Fibonacci Retracement
Drawing Fibonacci levels from the swing low ($134.79 on June 17) to the swing high ($164.23 on July 10), key retracement zones emerge. The shallow pullback to $159.80 held firmly above the 23.6% level ($158.50), demonstrating robust demand. Confluence exists here with horizontal support at $159.80 and the 50-day MA. The 38.2% retracement ($152.50) aligns with the June consolidation zone, offering secondary support. The bounce from $159.80 validates this Fibonacci support, targeting a retest of the $164–167 resistance area.
Confluence and Divergence
Strong confluence appears near $159–160, where Fibonacci support, the 50-day MA, and volume-backed price reversals converge. This level now serves as a critical bull/bear pivot. Earlier bearish divergence occurred briefly when MACD flattened while price reached marginal new highs in early July, but this resolved quickly. Presently, MACD, KDJ, and volume align bullishly, suggesting upward continuity. Traders should monitor whether RSI sustains below 70 to avoid overbought warnings.
In summary, BlackstoneBX-- exhibits robust technical structure, with momentum, volume, and key support levels aligning for potential further upside. The $166–168 resistance zone is pivotal; a decisive break above could catalyze trend acceleration, while failure to hold $159.80 may signal consolidation.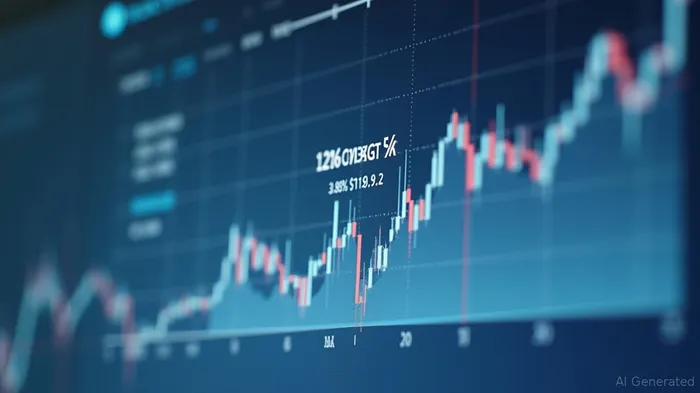
Divulgación editorial y transparencia de la IA: Ainvest News utiliza tecnología avanzada de Modelos de Lenguaje Largo (LLM) para sintetizar y analizar datos de mercado en tiempo real. Para garantizar los más altos estándares de integridad, cada artículo se somete a un riguroso proceso de verificación con participación humana.
Mientras la IA asiste en el procesamiento de datos y la redacción inicial, un miembro editorial profesional de Ainvest revisa, verifica y aprueba de forma independiente todo el contenido para garantizar su precisión y cumplimiento con los estándares editoriales de Ainvest Fintech Inc. Esta supervisión humana está diseñada para mitigar las alucinaciones de la IA y garantizar el contexto financiero.
Advertencia sobre inversiones: Este contenido se proporciona únicamente con fines informativos y no constituye asesoramiento profesional de inversión, legal o financiero. Los mercados conllevan riesgos inherentes. Se recomienda a los usuarios que realicen una investigación independiente o consulten a un asesor financiero certificado antes de tomar cualquier decisión. Ainvest Fintech Inc. se exime de toda responsabilidad por las acciones tomadas con base en esta información. ¿Encontró un error? Reportar un problema

SOBRE NOSOTROS
Nuestra historiaAutores de noticiasBase de conocimientosPolítica de privacidadTérmino de usoDescargo de responsabilidad de corretaje de tercerosTérminos de uso de AIMEDivulgaciones de riesgos de AInvest AICarrerasCONTÁCTENOS
Email: support@ainvest.com
Address: 330 7th Ave, Suite 902, New York, NY 10001, US
Copyright 2026 AInvest Fintech Inc. All rights reserved.
Comentarios
Aún no hay comentarios