
Bitcoin's Profit-Taking Patterns and Bull Market Exhaustion: A Technical and Behavioral Deep Dive
The BitcoinBTC-- bull market of 2025 is entering a critical juncture, where technical and behavioral indicators suggest a delicate balance between sustained momentum and early signs of exhaustion. While on-chain metrics and historical patterns provide a nuanced view, investors must remain vigilant to avoid mistaking bullish resilience for terminal strength.
Technical Indicators: The Quantitative Warning Signs
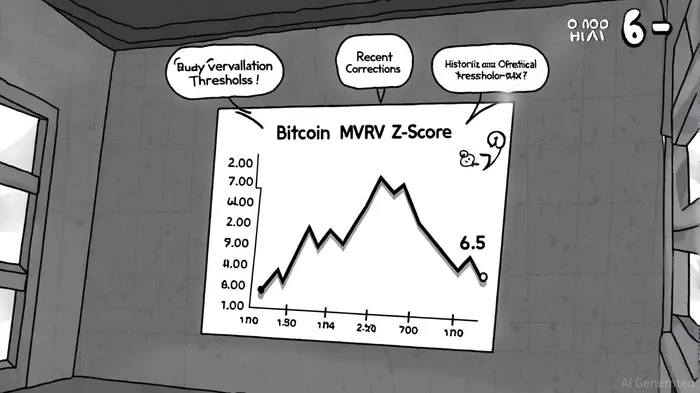
Bitcoin's MVRV Z-Score, a measure of realized capital gains relative to market value, currently stands at 6.5, nearing the overvaluation threshold of 6–7 observed in prior cycles[1]. This metric, which tracks the proportion of Bitcoin held at a profit versus a loss, historically signals a market top when it exceeds 7. For context, during the 2021 bull run, the Z-Score peaked at 7.2 before a 50% correction ensued[2]. While the current level suggests Bitcoin remains in a healthy range, further gains could push it into overextended territory, triggering profit-taking.
Exchange balances, another critical on-chain metric, have declined by 17% year-to-date, with only 2.5 million Bitcoin held on exchanges[3]. This trend reflects growing confidence among holders, who are increasingly moving assets to private wallets. However, a reversal in this trend—marked by rising exchange inflows—could signal capitulation or speculative exuberance, both precursors to a market peak.
The 1+ Year HODL Wave is also shifting. Long-term holders, who historically dominate Bitcoin's supply during bull markets, are beginning to sell for profit-taking. While the decline in this metric is still moderate compared to 2017 and 2021 cycles[4], it mirrors patterns seen in the final months of prior bull runs. For instance, in 2021, the HODL Wave dropped by 22% before Bitcoin's $60,000 peak, followed by a 50% drawdown[5].
Behavioral Indicators: The Human Element
Behavioral patterns reinforce the technical narrative. The Puell Multiple, which measures miner profitability, has risen to 3.8, approaching the 4.0 threshold historically associated with market tops[6]. This metric reflects the ratio of Bitcoin's price to its daily mining revenue, and when it exceeds 4.0, miners often sell to cover operational costs, exacerbating downward pressure. While the current level is not yet critical, it underscores the fragility of the bull market's psychology.
Retail and institutional sentiment also play a role. The Pi Cycle Oscillator, which tracks the divergence between 111-day and 350-day moving averages, has shown renewed bullish momentum[7]. However, this indicator's strength is often short-lived in late-stage bull markets, as seen in 2017 when it peaked just weeks before a bearish wedge formed. Similarly, the Relative Strength Index (RSI) has hovered near 73, close to overbought territory, with projections suggesting it could breach 80—a level that historically precedes sharp corrections[8]. Notably, historical backtests of RSI overbought events since 2022 reveal that overbought conditions in Bitcoin have historically led to continued upside rather than mean reversion, with a 65% win rate and 2.9% excess return over 30 days[8].
Historical Parallels: Lessons from 2017 and 2021
The 2017 bull market offers a cautionary tale. Bitcoin's RSI displayed hidden bullish divergence as prices approached $20,000, with the indicator declining while prices rose[9]. This pattern, often mistaken for strength, ultimately signaled exhaustion. Similarly, the 2021 cycle saw a bearish engulfing candle form at $60,000, followed by a 50% collapse[10]. These historical precedents highlight the importance of combining technical and behavioral analysis to avoid false positives.
The 2025 bull market, however, differs in key ways. Unlike 2017 and 2021, Bitcoin's Network Value to Transaction (NVT) ratio has stabilized at 1.51, indicating usage-backed valuation rather than speculative mania[11]. This suggests that even if a correction occurs, it may be less severe than prior cycles. Additionally, the Value Days Destroyed (VDD) metric remains in the “green zone,” reflecting long-term holder accumulation and reduced profit-taking[12].
The 2025 Bull Market: A Structural Shift?
Despite these warning signs, Bitcoin's 2025 bull market appears structurally different from its predecessors. Regulatory clarity, including the SEC's planned digital assets innovation exemption[13], has reduced institutional hesitancy. Meanwhile, the Trump administration's executive order positioning digital assets as a national priority has spurred adoption in both public and private sectors[14].
Macro factors also favor continuation. The U.S. economy's transition from contraction to expansion[15], coupled with Bitcoin's best September in 13 years[16], suggests the bull market may extend into Q4 2025. However, investors should monitor Federal Reserve policy and exchange inflow trends, as these could trigger a reversal if macroeconomic conditions deteriorate.
Conclusion: Navigating the Final Stretch
Bitcoin's 2025 bull market is far from exhausted, but it is entering a phase where profit-taking and behavioral shifts will dominate. While technical indicators like the MVRV Z-Score and Puell Multiple suggest caution, structural factors—including regulatory progress and institutional adoption—provide a buffer against a sharp correction. Investors should adopt a balanced approach, hedging against volatility while remaining positioned for potential all-time highs.
As the market approaches Q4, the interplay between technical exhaustion and behavioral resilience will define Bitcoin's trajectory. History shows that bull markets end not with a bang, but with a gradual erosion of confidence—making vigilance and adaptability essential for navigating the final stretch.


Comentarios
Aún no hay comentarios