

Bitcoin's October 2025 Pullback: A Technical and Sentiment Deep Dive
Bitcoin's October 2025 Pullback: A Technical and Sentiment Deep Dive
Bitcoin's recent pullback from its October 2025 peak of $126,198 has sparked debate about the sustainability of its long-term bullish momentum. While the correction aligns with historical patterns of volatility, a closer examination of technical indicators, on-chain metrics, and market sentiment reveals a nuanced picture. This analysis synthesizes these elements to assess whether the pullback signals a temporary consolidation or a structural shift in Bitcoin's trajectory.
Technical Analysis: Consolidation Amid Strong Fundamentals
Bitcoin's October rally was driven by a confluence of factors: a dovish Federal Reserve, institutional adoption via spot ETFs, and tightening supply dynamics. The price surged past the $118,000–$120,000 resistance zone, breaking through months of consolidation and triggering a short squeeze that liquidated over $330 million in bearish positions, according to an Aurpay analysis. This breakout was reinforced by bullish technical signals:
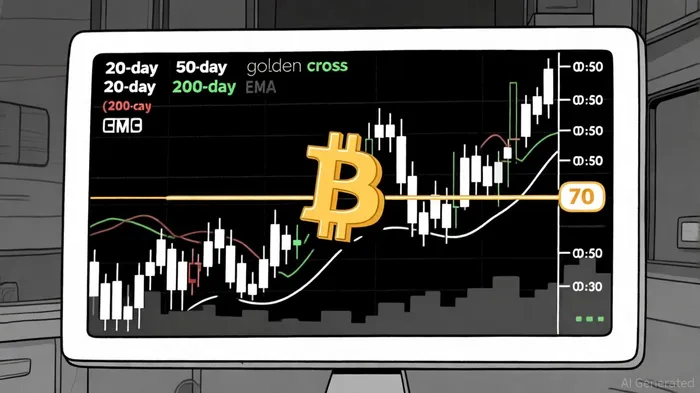
- Relative Strength Index (RSI): The RSI hovered near 70, indicating strong momentum without entering overbought territory (typically above 75), according to a Mudrex outlook.
- Moving Averages: The 50-day EMA crossed above the 200-day EMA, forming a "golden cross" that historically signals bull markets. BitcoinBTC-- also traded above the 20-day, 50-day, and 100-day EMAs, suggesting sustained upward pressure, per the Mudrex outlook.
- Support/Resistance Levels: The $118,000–$122,000 range has become a critical support zone, while the next resistance lies at $126,500–$127,000. Analysts project a potential move toward $130,000 if Bitcoin sustains above $126,500, according to the Mudrex outlook.
However, the recent pullback has seen Bitcoin fall below the 50-day and 200-day EMAs, raising concerns about bearish momentum. A 12% correction from the all-time high aligns with historical averages for mid-cycle corrections, which typically range from 20% to 80%, according to a Publish0x review. Yet, the price remains above the 20-day EMA, suggesting that short-term volatility may not derail the broader uptrend.
On-Chain Metrics: Mixed Signals in a Tightening Market
On-chain data provides further clarity. The MVRV (Market Value to Realized Value) ratio has crossed into a bearish "death cross," a historical precursor to major corrections, according to an XT on-chain analysis. However, the MVRV Z-Score-which measures overvaluation relative to historical norms-remains below levels associated with market tops (e.g., above 7). This suggests that while the pullback is concerning, Bitcoin's valuation is not yet extreme, as the XT analysis notes.
The Network Value to Transactions (NVT) ratio offers a counterpoint. A "golden cross" in NVT indicates that Bitcoin's valuation is supported by real transactional activity rather than speculative frenzy, a point also raised in the XT analysis. Additionally, Spent Output Profit Ratio (SOPR) data shows that 99.4% of Bitcoin addresses are in profit, a metric historically linked to major price peaks, as reported in a Binance report. This widespread profitability reflects strong retail participation and a reluctance to sell at current levels.
Historical Context: Corrections as Buying Opportunities
Bitcoin's history is marked by sharp corrections followed by robust recoveries. For example, the 2017–2020 correction saw an 84% decline, but the market rebounded within 18 months. Similarly, the 2021–2022 correction of 53% resolved in five months, as noted in the Publish0x review. The current pullback, a 12% decline from the October 2025 peak, falls within the bounds of a typical mid-cycle correction.
Historical patterns also suggest that October corrections-often dubbed "Uptober"-tend to reverse quickly. Despite the recent deviation from this trend, that Publish0x review indicates an 85% probability of recovery within five to ten trading days. Furthermore, Fibonacci-based projections in the review point to a potential bottom by mid-November 2025, with a recovery expected by mid-November.
Market Sentiment: Greed and Structural Shifts
Market sentiment remains a critical variable. The Bitcoin Fear & Greed Index has shifted decisively into "Greed" territory, reflecting optimism driven by FOMO (fear of missing out) and institutional demand, a dynamic highlighted in the Binance report. On-chain metrics reinforce this bullishness:
- Short Squeeze: The liquidation of $330 million in short positions during the October rally demonstrated a structural shift in market sentiment, the Binance report notes.
- Address Activity: According to the Binance report, over 99.4% of Bitcoin addresses are in profit, with 74% of the circulating supply illiquid (unmoved for over six months). This "tightening supply" dynamic suggests that large holders are accumulating, not selling.
Retail investor behavior also plays a role. Increased participation in spot ETFs and social media-driven hype have amplified demand, even as macroeconomic factors-such as the Federal Reserve's dovish pivot-support Bitcoin as a hedge against fiat devaluation, per the Mudrex outlook.
Conclusion: A Test of Conviction
Bitcoin's October 2025 pullback is a test of long-term bullish momentum. While technical indicators like the MVRV death cross and declining EMAs raise caution, the broader context-strong fundamentals, robust on-chain metrics, and historically resilient recovery patterns-suggests that the correction is a temporary consolidation rather than a breakdown.
For investors, the key will be monitoring whether Bitcoin sustains above critical support levels ($118,000–$122,000) and whether on-chain metrics like the MVRV Z-Score normalize. If these conditions hold, the path to $130,000-and beyond-remains intact.


Comentarios
Aún no hay comentarios