
Bitcoin's OBV Divergence: A Window into Institutional Accumulation and Market Structure
Bitcoin's on-balance-volume (OBV) divergence has emerged as a critical signal for institutional accumulation, offering a unique lens into market structure and sentiment. As the price consolidates between $102,000 and $112,000 since May 2025, the OBV continues to rise, indicating growing buying pressure beneath the surface, according to a Cointelegraph analysis. This divergence-a hallmark of accumulation-suggests that institutional actors are quietly building positions, a pattern historically followed by sharp price surges.
The Mechanics of OBV Divergence and Institutional Accumulation
OBV measures cumulative volume flow relative to price, with rising OBV during sideways price action signaling "hidden accumulation." In March–April 2025, a similar OBV divergence preceded a 57% rally, pushing BitcoinBTC-- above $110,000 by May, as noted in the Cointelegraph analysis. Today, the same dynamics are unfolding, with analysts like Cas Abbé noting that the current OBV trajectory aligns with a potential breakout toward $130,000–$135,000 by Q3 2025 (the Cointelegraph piece discussed this outlook).
Institutional flows corroborate this narrative. Galaxy Digital's Mike Novogratz attributes the bullish setup to strong institutional demand and a weakening U.S. dollar, projecting a $130,000–$150,000 target (as the Cointelegraph article observed). Meanwhile, macroeconomic tailwinds-such as expectations for a Federal Reserve rate cut and weak U.S. economic data-further amplify the case for accumulation, according to the BTCUSD weekly analysis.
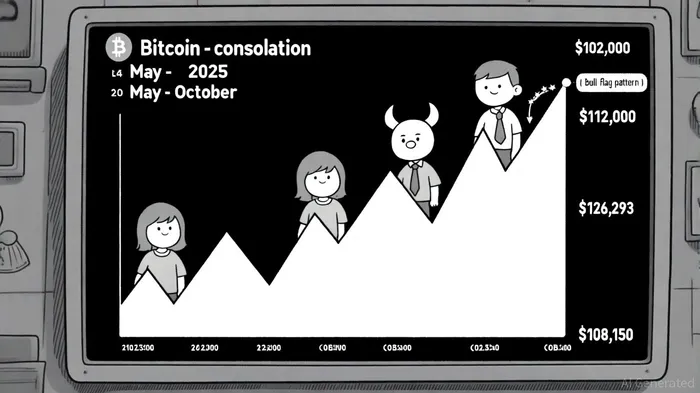
Market Structure: Bull Flag and Key Levels
The price action itself reinforces the bullish thesis. A classic bull flag pattern has formed, with the "flagpole" established during Bitcoin's May surge to $112,000 and the consolidation phase creating the "flag," a setup highlighted in the Cointelegraph coverage. This pattern, a continuation setup, historically signals a strong upward move post-consolidation.
Critical resistance now sits at $126,293, the level Bitcoin briefly breached on October 10, 2025, according to the Cointelegraph piece. Strategic support levels at $108,150 and $105,000 act as key psychological barriers, with the monthly pivot at $113,098 further anchoring the bullish structure (the Cointelegraph article outlines these levels). However, caution is warranted: a breakdown below $119,345 could trigger a short-term correction toward $117,500 or even $108,200, as noted in a technical analysis report.
Macroeconomic Tailwinds and ETF Inflows
Institutional demand is being fueled by macroeconomic factors and product innovation. Bitcoin ETF inflows remain robust, though their pace has slowed recently, signaling potential exhaustion in retail momentum (the BTCUSD weekly analysis discussed ETF flows). Meanwhile, a weaker dollar and global macroeconomic uncertainty are driving capital toward Bitcoin as a hedge, with analysts like Stockmoney Lizards eyeing a year-end target of $200,000 (covered in the Cointelegraph piece).
Retail sentiment, however, remains fragile. The Fear and Greed Index oscillates frequently, reflecting retail traders' susceptibility to short-term volatility, as highlighted in the Bitcoin price forecast. This contrast between institutional confidence and retail fragility underscores Bitcoin's evolving role as an asset class increasingly dominated by institutional players.
Recent Price Action and the Path Forward
Bitcoin's recent surge to a new all-time high of $126,293 on October 10, 2025 highlights the market's resilience (noted in the Cointelegraph coverage). Yet, technical indicators suggest consolidation is likely. Weekly analysis notes decreasing volume during the $11,500–$12,100 range, signaling indecision among traders (the BTCUSD weekly analysis highlighted this decrease). Historical patterns following the April 2024 halving also point to a potential peak around October 13, 2025, according to a TradingView analysis.
For investors, the key is to balance optimism with prudence. While OBV divergence and institutional flows point to a high-probability breakout, liquidity conditions and macroeconomic shifts could introduce volatility. Position sizing and stop-loss strategies near key support levels ($108,150–$105,000) are advisable.

Comentarios
Aún no hay comentarios