
Bitcoin's Market Cycle in September 2025: Technical Divergence and Sentiment Signals Point to a Pivotal Turning Point
Bitcoin's market cycle in September 2025 has reached a critical inflection point, marked by conflicting signals from technical indicators and a volatile mix of market sentiment. As the cryptocurrency trades within a $108,000–$125,000 range, investors are scrutinizing whether this is a topping pattern or a prelude to a deeper correction.
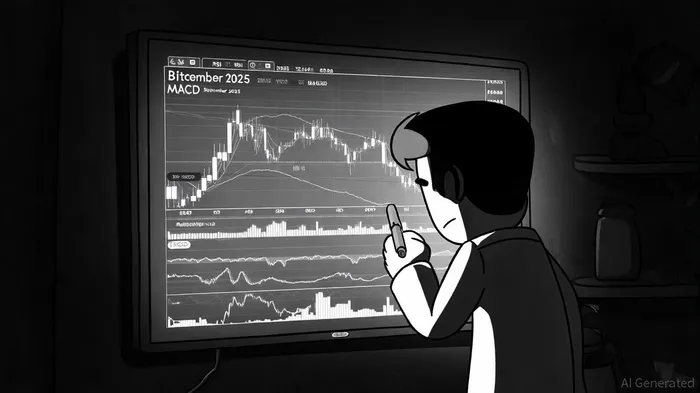
Technical Indicators: A Tale of Two Signals
Bitcoin's technical landscape is a mosaic of contradictions. Short-term momentum indicators like the Relative Strength Index (RSI) remain in bearish territory, with a 14-day RSI of 47.22 as of early September, signaling weakening bullish momentum, according to a 99Bitcoins technical analysis. However, the Moving Average Convergence Divergence (MACD) tells a different story. The histogram has surged to 638.0816, with the MACD line crossing above the signal line-a classic bullish setup suggesting potential continuation of the uptrend, per a Blockchain.News price prediction.
Historical backtests of MACD Golden Cross events, however, reveal mixed reliability. A 2022–2025 analysis of 54 such events showed an average 30-day return of +4.0% versus a +3.4% benchmark, with a win rate of ~49%, as demonstrated in a MACD golden-cross backtest. While the MACD Golden Cross is a widely recognized bullish signal, these results suggest its predictive power for BTC has not consistently outperformed the broader market trend over the past four years.
Moving averages further complicate the narrative. BitcoinBTC-- currently trades below its 50-day ($115,234.14) and 100-day ($111,137.08) moving averages, a bearish sign as the MA50 approaches a death cross under the MA100, according to a Mudrex technical analysis. Yet the 200-day moving average ($101,713.87) remains a robust support level, with the SMA 200 at $103,619.89 still showing a bullish bias despite short-term weakness. Traders are closely watching for Bitcoin to reclaim these key moving averages and break above the $118,000 resistance zone, which could validate a continuation of the bullish thesis (the 99Bitcoins analysis mentioned earlier highlights this level).
A decisive break above $124,474 is critical for maintaining optimism, while a failure to hold above $100,000 could trigger further selling pressure, testing historical support levels (Blockchain.News previously noted this threshold). Hidden bullish divergences in RSI and price action have also sparked debate among analysts, with some suggesting a potential reversal could push Bitcoin toward $120,000 or even $200,000 by year-end, according to a Parameter price prediction.
Market Sentiment: Fear, Seasonality, and Macro Tailwinds
Market sentiment in September 2025 is a patchwork of caution and cautious optimism. The Bitcoin Fear and Greed Index plummeted to 28 on September 27-the lowest since March 2025-indicating extreme fear as prices dipped below $110,000 (this was also reported by Blockchain.News). This aligns with historical patterns: September has averaged a 3.77% decline over the past decade, with Bitcoin posting negative returns in eight of the last twelve years, according to an Analytics Insight analysis. Analysts warn of further declines toward $100,000, citing seasonal factors like tax-loss harvesting and reduced liquidity (the Analytics Insight piece expands on these seasonal risks).
Yet there are glimmers of hope. Exchange reserves for Bitcoin have hit a six-year low, signaling reduced selling pressure and a potential "bullish supply shock" (noted earlier in the 99Bitcoins coverage). Whale accumulation has also surged, with over 19,130 addresses holding large BTC balances, suggesting strategic buying by long-term holders (Analytics Insight also documents the accumulation data). Meanwhile, macroeconomic factors-such as the anticipated Federal Reserve rate cuts and a weakening U.S. dollar-could provide tailwinds for Bitcoin, particularly if prices hold above key support levels (Blockchain.News discussed these macro tailwinds).
Social media sentiment, however, remains a double-edged sword. Negative chatter spiked in late August, often followed by increased Bitcoin deposits to exchanges within 48–72 hours-a self-fulfilling bearish cycle (this pattern is described in the Analytics Insight report). Yet AI-driven models and attention-based hybrid CNN-LSTM analyses suggest that public sentiment on platforms like Twitter and Reddit could influence a reversal, especially if Bitcoin stabilizes in October (the Mudrex technical analysis explores these model-based signals).
The Path Forward: A Pivotal Turning Point
Bitcoin's September 2025 trajectory hinges on its ability to navigate these conflicting signals. Technically, a breakout above $124,474 would validate bullish momentum, while a breakdown below $100,000 could deepen the correction. Sentiment-wise, the market's extreme fear-coupled with low exchange reserves and whale accumulation-hints at a potential bottoming process.
Macro factors, particularly the Fed's policy shift, could act as a catalyst. With a 90% probability of rate cuts expected to boost liquidity, Bitcoin may find renewed support in October and November, historically its strongest months post-halving (the Analytics Insight piece outlines the seasonal strength). Analysts like Timothy Peterson predict a price range of $97,000–$113,000 by month-end, but a rebound to $120,000 or higher remains plausible if institutional demand and macro tailwinds align (the 99Bitcoins analysis references these scenarios).
For now, the market remains in a high-stakes waiting game. Traders must balance the bearish seasonal headwinds with the potential for a technical reversal and macro-driven recovery. As one analyst put it, "September is a test of Bitcoin's resilience-pass it, and the bulls reclaim control; fail it, and the bears dictate the next chapter."


Comentarios
Aún no hay comentarios