
Bitcoin's Key Resistance Breakout and Market Sentiment: A Short-Term Technical Playbook
Bitcoin's price action in late September 2025 has become a masterclass in short-term technical analysis, with the cryptocurrency oscillating between critical resistance and support levels that could define its trajectory for the remainder of the year. As of September 19, BitcoinBTC-- closed at $115,569.50, down 1.24% from the previous day but up 7.06% for the month[1]. This volatility has created a high-stakes chessboard for traders, with key levels like $113,000–$114,000 (resistance) and $111,000–$107,000 (support) acting as fulcrums for market sentiment.
Technical Analysis: The Battle for $113,000–$114,000
Bitcoin's recent attempt to break above the $113,000–$114,000 resistance band has been a focal point for technical analysts. This zone, historically a psychological and on-chain cluster point[3], has seen over 210,000 BTCBTC-- concentrated in the $113,200–$113,500 range[3]. A successful breakout would not only validate bullish momentum but also open the door to a retest of August highs near $124,000[1].
The RSI, currently hovering around 55–60, suggests neutral to slightly bullish momentum[3], while the MACD shows a weak bullish crossover, hinting at potential recovery[3]. However, the 200-day moving average (around $103,000–$104,000) remains a critical support level[3], and the 50-day SMA at $114,105[3] could act as a dynamic resistance. Bollinger Bands, which indicate low volatility, suggest a high probability of a significant price expansion—either upward or downward—depending on the outcome of this tug-of-war[3].
On-Chain Metrics and Volume: Confirming the Breakout
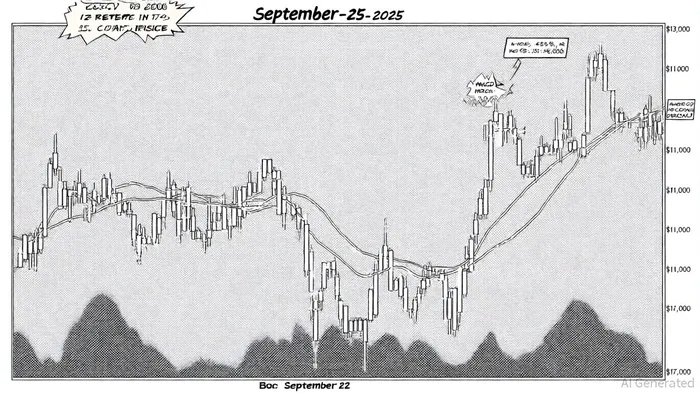
On-chain data provides mixed signals. While Bitcoin's UTXO Realized Price Distribution (URPD) highlights strong support near $107,000[3], open interest remains elevated at $79 billion, signaling fragile market structure[3]. A decisive close above $113,650 would confirm a breakout from the recent downtrend[2], but volume data is crucial. For instance, the September 22 correction below $115,000 triggered $1.7 billion in liquidations[3], underscoring the fragility of leveraged positions.
Volume analysis around key levels is equally telling. The $113,000–$114,000 zone has seen a surge in buying pressure, with over 23,000 BTC (worth $2.67 billion) purchased in a 24-hour period[2]. However, cumulative volume delta data suggests increasing chances of a deeper sell-off toward $106,000[2], particularly if institutional selling intensifies.
Market Sentiment: Bulls vs. Bears in a Seasonal Dilemma
Market sentiment remains divided. On one hand, institutional demand—driven by ETFs and corporate accumulation—has created a supply squeeze[1], with companies absorbing more Bitcoin than is being mined[1]. On the other hand, retail traders remain bearish, with the Fear & Greed Index at 43[1] and a “Red September” phenomenon historically averaging -3.77% returns since 2013[3].
Yet, there are bullish undercurrents. A “hidden bullish divergence” in Bitcoin's RSI suggests the market may not be as weak as it appears[3], and some analysts argue the 2025 September pattern mirrors the 2017 rebound after August weakness[3]. Additionally, the Federal Reserve's anticipated rate cuts and Bitcoin's role as a high-beta asset could fuel further gains[2].
Actionable Entry Strategies: Navigating the Crossroads
For traders, the coming weeks present a binary scenario:
1. Bullish Play: A breakout above $113,650 with sustained volume could justify long entries at $114,000–$115,000, with a take-profit target at $117,400 and a stop-loss below $112,000[2].
2. Bearish Play: A breakdown below $112,000—confirmed by a close below the 20-day SMA at $114,105[3]—could trigger a test of $107,000, with short positions initiated near $111,000[3].
Position sizing should account for the elevated open interest and liquidation risks. For example, a 1% risk per trade with a stop-loss at $107,000 would limit losses to $8,569.50 per $100,000 position[1].
Conclusion: A Pivotal Week for Bitcoin
Bitcoin's short-term trajectory hinges on its ability to conquer the $113,000–$114,000 resistance. A successful breakout could catalyze a move toward $124,500[3], while a breakdown may force a deeper correction to $103,000–$104,000[2]. Traders must remain agile, leveraging on-chain metrics and volume data to refine their strategies. As the Fed's policy decisions and seasonal volatility loom, September 2025 will be remembered as a defining chapter in Bitcoin's journey toward a new all-time high—or a cautionary tale of market fragility.


Comentarios
Aún no hay comentarios