
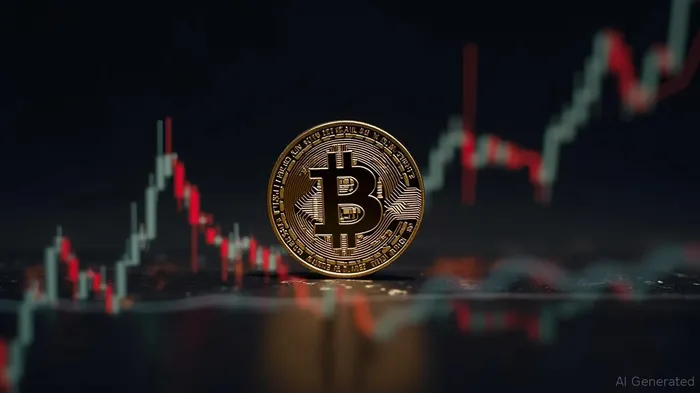
Bitcoin Hovers Around $107,600 Amid Descending Triangle Pattern
Bitcoin's price has been trending in a descending triangle pattern, currently hovering around $107,600. This pattern is characterized by consistent lower highs and a horizontal support line, with the resistance trendline tested multiple times since late May. The Ichimoku cloud, acting as a crucial support zone, is spread across the $103,000 to $105,000 range, providing a strong base for the price. The cloud has absorbed downward price pressure, reinforcing its significance in the current range-bound environment. The horizontal support around $104,000 has been defended multiple times by buyers, further emphasizing its importance.
The short-term trend direction of BitcoinBTC-- will be decided by a breakout or breakdown from the descending triangle pattern. A decisive move above the resistance line near $108,000 could signal a bullish reversal and a potential rally towards higher levels. Conversely, a breakdown below the support line could lead to a further decline. The market is currently in a state of uncertainty, with geopolitical tensions adding to the volatility. Despite this, high-net-worth investors and corporate support have been fueling new highs, indicating significant interest in Bitcoin. The formation of a bull-flag pattern on the daily chart also suggests that the price could be setting up for a breakout to the upside. However, the market remains cautious, and any significant price movement will depend on the outcome of the current consolidation phase.
Bitcoin's price action continues to be in a bearish falling triangle on the daily chart. Despite multiple lower highs since June, the Ichimoku cloud offers a strong support area around $104,000. The day’s chart has Bitcoin just above this level of support, and the Ichimoku cloud serving as a moving floor. However, the failure to break over the declining line of resistance again and again has restrained momentum. Price advanced to $108,109 on June 29 before falling back, exhibiting continued indecision. Interestingly, 24-hour volume rose to $48.12 billion, a virtual 14% gain, reflecting heightened market action.
Bitcoin is consolidating within a descending triangle pattern and is currently trading above the Ichimoku cloud, which is acting as a support. A decisive breakout or breakdown is needed to confirm the next directional move. The resistance trendline has been tested several times since late May, each time resulting in a pullback. As of July 2, BTC has failed to close above the trendline, which remains a critical resistance level near $108,000. The lower wick from the June 24 candlestick further confirms that buyers stepped in near the support level. The daily candle on July 2 has so far respected the top of the cloud, showing limited downside momentum.


Comentarios
Aún no hay comentarios