
Bitcoin's Critical Support Levels: A Strategic Guide for Traders in a Volatile Market
Bitcoin's price trajectory in October 2025 has underscored the critical role of technical analysis in navigating its inherent volatility. For traders, identifying and monitoring key support levels is not merely a strategy-it is a necessity for mitigating risk while capitalizing on potential breakouts. Recent market data reveals a complex interplay of support and resistance zones, with institutional activity and derivatives markets amplifying the stakes for both bulls and bears.
Key Support Levels and Market Dynamics
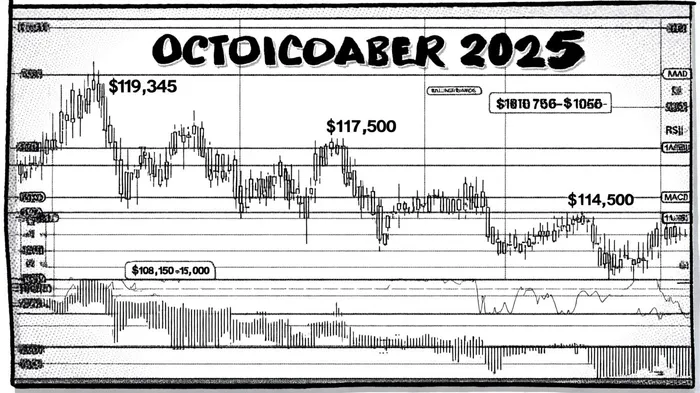
Bitcoin's recent correction from a resistance zone between $125,000 and the upper Bollinger Band has drawn attention to the $115,000 level as a short-term support target, as noted in a FinanceFeeds technical analysis. However, a deeper analysis reveals a layered defense system for the asset. According to a Cointribune report, BitcoinBTC-- rebounded from a critical support zone between $108,150 and $105,000 before surging to a record high of $126,293. This suggests that the $119,345 and $117,500 levels now serve as pivotal psychological and technical barriers.
Meanwhile, [Analytics Insight] (https://www.analyticsinsight.net/bitcoin/bitcoin-price-trades-around-121900-amid-strong-demand-for-bitcoin-etfs) notes that Bitcoin has consolidated around $121,000–$122,000, driven by robust institutional inflows and growing demand for Bitcoin ETFs. This consolidation phase, though seemingly stable, masks the fragility of the current bullish momentum. A breakdown below $119,345 could trigger a cascade of liquidations, potentially dragging prices toward the $99,000 level-a scenario emphasized by [FxLeaders] (https://www.fxleaders.com/news/2025/10/01/bitcoin-holds-114-technical-levels-signal-explosive-october-and-q4-ahead/) as a high-probability risk.
Resistance and the Path to $118,000
While support levels define downside risks, resistance zones dictate the potential for upward movement. Bitcoin's ability to surpass $114,750 and $115,500 resistance levels could catalyze a rally toward $118,000, as [BTCC] (https://www.btcc.com/en-US/square/blockchainNEWS/915422) projects. These tools currently signal a bullish setup, with the RSI hovering near overbought territory and the MACD histogram expanding positively. However, traders must remain cautious: a failure to breach $115,500 could rekindle bearish sentiment, forcing Bitcoin into a defensive mode.
Risk Management in a High-Stakes Environment
For traders, the interplay between support and resistance levels necessitates a disciplined approach to risk management. Stop-loss orders placed just below key supports-such as $117,500 or $115,000-can limit losses in a sudden downturn. Position sizing should also reflect the volatility: given Bitcoin's 24-hour trading volume and open interest spikes, aggressive leverage is ill-advised unless paired with tight risk parameters.
Derivatives markets further complicate the landscape. Rising open interest and positive funding rates in perpetual futures contracts indicate sustained institutional bullishness, according to Cointribune. Yet, these metrics can double as contrarian signals. For instance, a sharp decline in open interest during a rally might foreshadow a reversal, even if Bitcoin remains above critical supports.
Historical data from 2022 to 2025 reveals that a simple buy-and-hold strategy following a breach of Bitcoin's 30-day support level has yielded mixed results. Over 28 such events, the average cumulative return after 30 days was +1.76%-slightly below the benchmark's +3.47%-with a 50% win rate on day 30. Notably, no time horizon in the 1-30 day window showed statistical significance (p > 0.05), underscoring the high variability of this approach. While mild recovery occurred after initial weakness (days 8-13), the strategy consistently lagged the benchmark. This suggests that relying solely on support-level breaches without additional confirmation (e.g., volume spikes, macroeconomic triggers) may not add value.
Conclusion: Balancing Optimism and Caution
Bitcoin's October 2025 price action exemplifies the duality of opportunity and risk in cryptocurrency trading. While technical indicators and institutional demand suggest a favorable environment for bulls, the proximity of key support levels demands vigilance. Traders must treat each support zone as a potential inflection point-either a floor for a rebound or a trigger for deeper corrections. By integrating technical analysis with prudent risk management, investors can navigate Bitcoin's volatility with both strategy and resilience."""


Comentarios
Aún no hay comentarios