
Bitcoin's Critical Price Levels and Path to Trend Reversal
Key Price Levels and Technical Implications
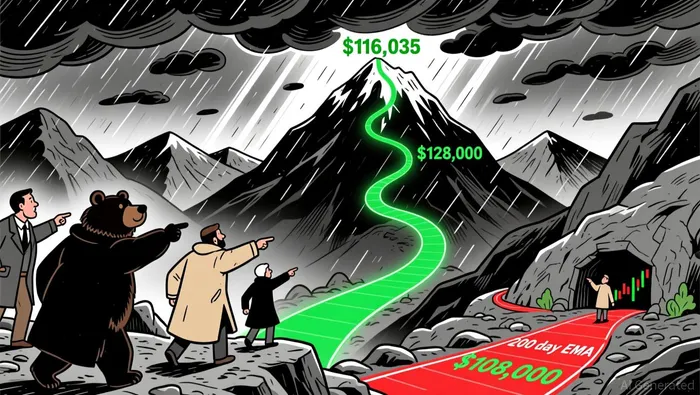
Bitcoin's daily chart reveals a tight consolidation pattern as it approaches the $116,035 resistance level, a zone that has historically repelled upward momentumMMT--, according to a Coinotag report. A sustained close above this level could trigger a surge toward $120,000, with the Supertrend indicator suggesting a secondary target at $124,500 and a potential continuation toward $128,000, as noted in a Sahm Capital analysis. Conversely, a breakdown below $116,035 would expose the $114,000–$115,000 support range, with the 200-day EMA at $108,000 serving as a critical secondary floor, as the Coinotag report also notes.
The market's low volatility, driven by a nearing completion of the daily ATR, indicates a range-bound phase in the near term. However, this calm could precede a sharp breakout, particularly if volume and RSI confirm directional bias, per the Coinotag report. Notably, BitcoinBTC-- remains within its ascending trendline from April 2025, preserving the broader bullish structure despite recent ETF outflows totaling $326 million, as Sahm Capital noted.
Institutional Positioning and Trend-Following Signals
Institutional sentiment, as reflected in open interest and leverage ratios, tells a nuanced story. Q3 2025 saw Bitcoin's open interest hit a record low of -25 variation, signaling a market cleansed of excessive leverage and historically preceding recovery phases, according to a Bitcoinist report. Yet, notional open interest in crypto futures and options surged to $31.3 billion, underscoring increased institutional participation, as the CME Group noted in its October 2025 Crypto Insights. This duality-retail capitulation versus institutional accumulation-creates a fertile ground for trend-following strategies.
The CME Group's data reveals a record 1,014 large open interest holders (LOIH) in Bitcoin derivatives as of September 16, 2025, indicating a broadening of market depth beyond a few dominant players, per the CME Group's report. Meanwhile, JPMorgan's 64% increase in holdings of the BlackRock iShares Bitcoin Trust (IBIT) to $343 million highlights strategic institutional positioning, even as CEO Jamie Dimon publicly dismisses Bitcoin, according to a Coinpaprika report. These moves suggest a growing acceptance of Bitcoin as a regulated asset class, despite lingering skepticism.
Leverage, Volatility, and Breakout Validity
The surge in leverage ratios during Q3 2025-driven by U.S. spot Bitcoin ETF approvals-has amplified market volatility. Total crypto loans reached $73.6 billion, a 35% quarter-over-quarter increase, with Bitcoin-linked borrowing accounting for a significant share, as noted in a The Tradable analysis. While this liquidity fuels short-term momentum, it also raises the risk of cascading liquidations during sharp corrections.
For breakout strategies, volume and RSI confirmation remain paramount. A bullish breakout above $116,035 would need to coincide with a surge in volume and an RSI reading above 55 to validate institutional buying. Conversely, a breakdown would require a drop below $114,000 with a corresponding RSI divergence to signal bearish exhaustion.
Path to Trend Reversal: A Cautious Outlook
Despite the technical and institutional signals, Bitcoin's path to a trend reversal is not without risks. The GENIUS Act's regulatory tailwinds for stablecoins have diverted institutional capital toward alternative crypto assets, with EthereumETH-- and SolanaSOL-- outperforming Bitcoin in Q3, as noted in a Bitwise review. This realignment could delay a sustained bullish breakout unless Bitcoin reasserts its dominance.
For traders, the key lies in balancing trend-following signals with risk management. A long bias is justified if Bitcoin clears $116,035 with strong volume, but stop-loss orders near $114,000 would be prudent. Conversely, a short position could be considered if the price fails to hold above $115,000, with a target toward $108,000.
Conclusion
Bitcoin's critical price levels in late 2025 represent a crossroads for the market. The interplay of technical indicators, institutional positioning, and leverage dynamics suggests a high-probability scenario for a breakout or breakdown in the coming weeks. While the ascending trendline and 200-day EMA provide a safety net for bulls, the surge in leverage and ETF outflows caution against complacency. Traders who align their strategies with these signals-while maintaining strict risk controls-may find themselves well-positioned to capitalize on the next leg of Bitcoin's journey.


Comentarios
Aún no hay comentarios