
Bitcoin Capitulation Events: Decoding On-Chain Behavior and Market Psychology
Bitcoin's market cycles are a dance of fear and greed, where capitulation events—moments of mass panic selling—serve as both catalysts for bottoms and harbingers of speculative peaks. By dissecting on-chain metrics like the MVRV (Market Value to Realized Value) ratio, Coin Days Destroyed (CVDD), and HODL Waves, we can decode the psychological undercurrents driving Bitcoin's price action. These metrics, when analyzed through the lens of historical patterns, offer a roadmap for investors navigating the cryptocurrency's volatile terrain.
The Anatomy of Capitulation: On-Chain Metrics as Sentiment Barometers
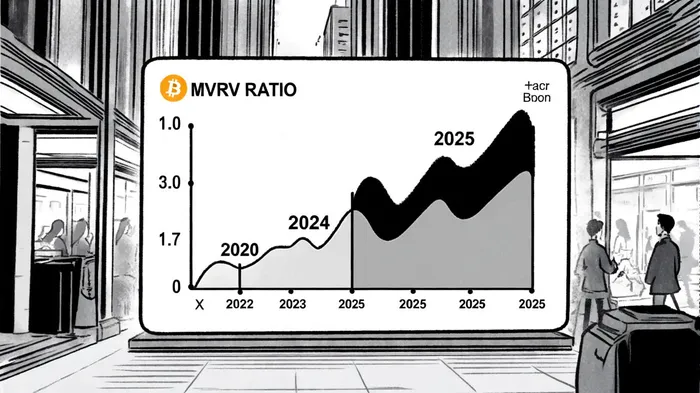
Capitulation events are best understood through the lens of Bitcoin's supply dynamics. When the MVRV ratio for short-term holders (STHs) dips below 1.0, it signals that the current price is trading at a discount to the average cost basis of recent buyers—a condition of undervaluation. In April 2025, the STH MVRV ratio fell to 0.82, indicating that 18% of short-term holders were underwater, a classic sign of market stress[2]. This metric historically precedes capitulation, as weak hands exit while long-term holders accumulate.
Conversely, when BitcoinBTC-- approaches the MVRV +1 Standard Deviation level (~3.7), it often signals overvaluation and speculative euphoria[1]. For instance, during the 2021 bull run, Bitcoin repeatedly brushed against this threshold before correcting. The Terminal Price concept—Bitcoin's theoretical ceiling based on its 21 million supply—further underscores this dynamic. When prices near this line, as seen in 2021 and 2025, overheating and profit-taking typically follow[5].
HODL Waves: The Battle Between Speculation and Conviction
HODL Waves, which map the distribution of Bitcoin holdings by age, reveal critical shifts in market psychology. During bull markets, short-term holding bands expand as new buyers enter, often at inflated prices. This was evident in 2017 and 2021, where speculative inflows created market tops[4]. Conversely, during bear markets, long-term holders dominate, with older coins remaining unspent. The 1yr HODL Wave line, for example, has an inverse relationship with Bitcoin's price, peaking as selling pressure from experienced investors intensifies[3].
In 2025, the 6-month-and-below Realized Cap HODL Waves band stood at 55%, far below the 80% threshold historically associated with market tops[6]. This suggests the current cycle has room to grow before entering speculative territory. Meanwhile, the proportion of Bitcoin held for over a decade is rising, reinforcing Bitcoin's narrative as a store of value[1].
CVDD and the Psychology of Panic
Coin Days Destroyed (CVDD) measures the destruction of coin days when long-held coins are moved, often signaling panic selling. A spike in CVDD typically flags undervaluation, as seen in February 2025 when 79,000 BTC was liquidated at a loss, resulting in $1.7 billion in realized losses[5]. This pattern mirrors previous bottoms in 2024, where CVDD spikes coincided with long-term holders absorbing supply[1].
However, CVDD's utility extends beyond capitulation. During bull runs, it highlights retail participation, as new buyers move older coins into circulation. For example, in 2021, CVDD spikes aligned with speculative frenzies, as short-term holders cashed out[2].
Market Psychology: From Exchange Flows to Social Sentiment
Capitulation events are not purely technical; they are deeply psychological. During the 2020 pandemic crash, increased outflows from exchanges suggested investors were HODLing through the storm, stabilizing prices[2]. Similarly, in 2025, the Global In/Out of the Money (GIOM) metric showed 95% of addresses in profit but purchased near the $116,000–$119,000 range, creating a resistance band[4]. This psychological barrier often delays recovery phases until new buyers absorb the supply.
Social media sentiment, particularly on platforms like Twitter, also plays a role. During bear markets, sentiment correlates weakly with price, as fundamentals—like institutional adoption—take precedence[3]. For instance, the Trump administration's 2025 executive order on crypto regulation injected stability, encouraging long-term capital inflows[3].
The Road Ahead: Navigating the 2025–2026 Cycle
Bitcoin's current trajectory suggests a constructive phase. While a break below $92,000 could trigger a 37% correction, the market's resilience—evidenced by large holder netflows and ETF activity—points to institutional accumulation[5]. The shrinking liquid supply, coupled with derivative markets diluting supply shocks, may also dampen volatility[1].
For investors, the key lies in balancing on-chain signals with macroeconomic trends. The 2025 halving and regulatory clarity are reshaping Bitcoin's cycle, potentially ending the traditional four-year boom-and-bust pattern[3]. As HODL Waves shift toward long-term conviction and CVDD signals undervaluation, the next phase of Bitcoin's journey promises both opportunity and caution.


Comentarios
Aún no hay comentarios