
Bitcoin's Bull Run: Can $160K Be Next? Decoding the On-Chain Signals
Bitcoin has been on a steady climb this year, but skeptics are asking: Is the $160K target realistic, or are we nearing a peak? Let's dive into CryptoQuant's on-chain data and historical cycles to find answers.
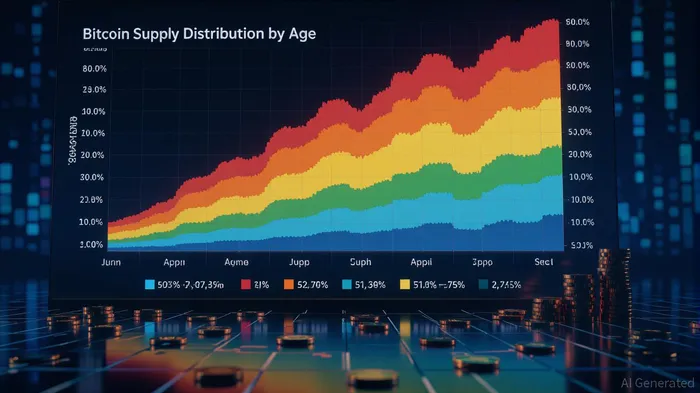
The Scarcity Engine: Why Bitcoin's Supply is Tightening
The April 2024 halving slashed new Bitcoin issuance to just 900 BTC per day, creating a “supply shock” that's tightening the market. Here's the math:
- 74% of all Bitcoin (14.6 million of 19.8 million total) haven't moved in over two years.
- 75% of the supply has been dormant for at least six months, locking up liquidity.
This isn't just hoarding—it's a HODL wave of historic proportions. With fewer coins available to meet demand, even modest buying pressure could send prices soaring.
Technical Indicators: The NVT Golden Cross and More
The Network Value to Transactions (NVT) ratio is a critical gauge of Bitcoin's valuation relative to real-world use.
- A golden cross (when the short-term moving average crosses above the long-term average) signals undervaluation. The current NVT of 1.51 is far below the 2.2 “bubble” threshold, meaning Bitcoin is still grounded in utility, not speculation.
Holder Behavior: Profit-Taking or Long-Term Conviction?
- Realized Capitalization: Surged past $900 billion, marking a new all-time high. This means long-term holders have locked in gains, but aren't selling.
- SOPR (Spent Output Profit Ratio): At 1.03, coins are being moved at or just above breakeven.
- MVRV (Market Value to Realized Value): A 2.3× multiple shows long-term holders are up 230%, but short-term traders only 13%.
This isn't a “panic sell”—it's a healthy correction. Institutional holders are buying dips, not fleeing.
Institutional Inflows: The ETF Fuel
Bitcoin's rise isn't just about code—it's about capital flows.
- Bitcoin spot ETFs now hold $131 billion in assets, with BlackRock's IBIT leading at $4.8 billion.
- Standard Chartered and Bernstein forecast $200K by year-end, citing Bitcoin's “digital gold” narrative and ETF-driven demand.
Even Michael Saylor (yes, the guy who bought Bitcoin at $500) is bullish, arguing that $160K is a conservative target given halving scarcity.
Cycle Timing: When Does the Bull End?
Bitcoin's four-year cycle suggests we're in the third year of a bull run (post-2021 lows). Historically, this phase sees 120%+ gains.
- The last post-halving cycle (2020–2021) peaked 14 months after the halving. At this rate, Q4 2025 could be the climax.
Red Flags: Don't Get Overconfident
- Macro Risks: A recession or Fed rate hike could spook markets. Bitcoin's correlation with equities isn't dead yet.
- Overvaluation Risks: The S2F model has overstated prices since 2021. Stick to on-chain signals, not just theory.
- Derivatives Overhang: Excessive futures trading could amplify volatility if traders panic.
Action Items for Investors
- Accumulate on Dips: Use pullbacks to $95K–$100K as buying opportunities.
- Monitor NVT and MVRV: A rising NVT or MVRV Z-Score over 3 could signal overextension.
- Avoid Leverage: Stick to spot purchases or long-dated options to avoid rollover costs.
Final Take
The data is clear: Bitcoin's supply squeeze, institutional inflows, and historical cycle timing all point toward a $150K–$200K finish in 2025. But remember—cycles end when greed turns to fear. Stay disciplined, and let the on-chain signals guide you.
Final Word: The path to $160K is paved with data, not hype. Ride the wave, but keep one eye on the horizon.


Comentarios
Aún no hay comentarios