
Bitcoin's Bear Market Signals and Path to Recovery: A Technical and On-Chain Deep Dive
On-Chain: A Bear Market Threshold Broken
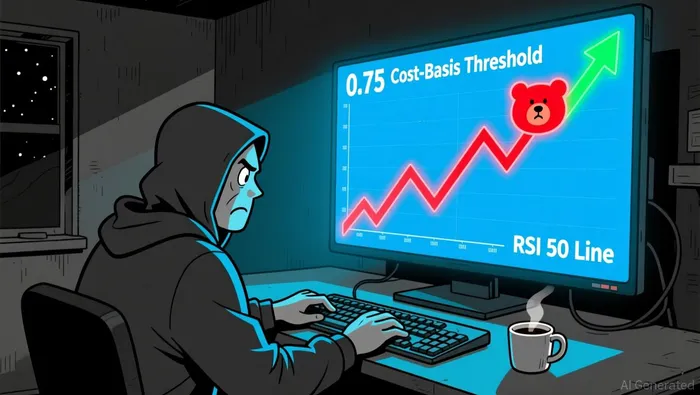
According to Glassnode's on-chain analysis, BitcoinBTC-- has fallen below the 0.75 cost-basis quantile-a critical threshold that historically demarcates bear market conditions. This metric reflects the proportion of Bitcoin holders who bought their coins at a price lower than the current market value. When Bitcoin dips below this level, it indicates that a significant portion of holders are now underwater, often triggering increased selling pressure as investors seek to cut losses. Reclaiming this threshold, Glassnode emphasizes, is essential for restoring a bullish market structure.
Notably, long-term holders (LTHs)-those holding Bitcoin for over a year-are showing early signs of easing their sales. While still bearish, this trend hints at a potential stabilization phase. LTHs typically act as a stabilizing force during downturns, as their reduced selling activity can slow the downward spiral. However, this alone is insufficient to reverse the bearish narrative without broader market participation.
Technical Analysis: RSI and Moving Averages Signal Weakness
From a technical perspective, Bitcoin's Relative Strength Index (RSI) and moving averages reinforce the bearish outlook. Data from Barchart indicates that Bitcoin's 50-Day RSI stands at 39.06, while the 100-Day RSI is at 45.18. Both values remain below the 50 neutral threshold, signaling weakening momentum and a lack of buyer interest. The 90-Day RSI, though not explicitly provided, can be inferred to trend lower given the declining pattern across longer timeframes.
Moving averages further underscore the downtrend. The 5-Day moving average sits at $89,206.03, significantly below the 200-Day average of $103,816.27. This "death cross" pattern-where short-term averages fall below long-term ones-often precedes extended bear markets. The widening gap between these averages suggests sustained selling pressure and a lack of conviction among traders to push prices higher.
The Path to Recovery: What Needs to Change?
For Bitcoin to transition from bear to bull, two key conditions must align:
Reclaiming the 0.75 Cost-Basis Quantile: As highlighted by Glassnode, this threshold is a psychological and structural linchpin for bullish momentum. A sustained move above this level would signal that LTHs are no longer net sellers, potentially attracting new buyers and reducing downward pressure.
RSI and Moving Average Convergence: A reversal in the RSI trend-specifically, a move above 50 for the 50-Day and 100-Day RSI-would indicate renewed buyer interest. Similarly, a "golden cross" where short-term moving averages cross above long-term ones would act as a catalyst for a bullish breakout.
Historically, Bitcoin's recoveries have been driven by a combination of on-chain resilience and technical catalysts. For example, during the 2018-2019 bear market, a surge in LTH accumulation and a breakout above key RSI levels preceded the 2020 bull run. The current environment, while challenging, mirrors these patterns in its early stages.
Conclusion: Bear Market Dynamics and the Road Ahead
Bitcoin's bear market in November 2025 is firmly entrenched, supported by both on-chain and technical indicators. Yet, the market is not without hope. The easing of LTH selling and the potential for RSI normalization suggest that the bear phase may be nearing a critical inflection point. Investors should monitor the 0.75 cost-basis quantile and moving average convergence as key signals for a potential reversal. Until then, caution remains warranted, but the tools for recovery are still within reach.


Comentarios
Aún no hay comentarios