
Bitcoin's 16% Correction: Is This the Buy-Point or the Precursor to a Larger Crisis?
Bitcoin's 16% correction in early October 2025 has ignited fierce debate among investors and analysts. After surging to an all-time high of $126,293, the cryptocurrency plunged to $108,000 within days, erasing $280 billion from the crypto market cap, according to a Markets FinancialContent report. While some view this as a healthy "leverage reset," others warn of a deeper bearish shift. This analysis examines the interplay of market sentiment and technical indicators to determine whether the correction presents a buying opportunity or signals a larger crisis.
Market Sentiment: Fear, Accumulation, and Institutional Resilience
The correction triggered a sharp shift in sentiment. The Crypto Fear & Greed Index plummeted to the "Fear" zone, reflecting panic-driven liquidations of $19 billion in leveraged positions (per the Markets FinancialContent report). However, on-chain data tells a nuanced story. Smaller holders (1–1,000 BTC) continued net accumulation even as prices fell from $118,000 to $108,000, suggesting retail investors are treating dips as buying opportunities, according to a Yahoo Finance analysis.
Institutional demand remains a critical stabilizer. Global Bitcoin ETF inflows reached $5.95 billion by October 4, 2025, despite mid-month outflows of $530 million, as reported in an Analytics Insight piece. This duality highlights a divide: retail fear vs. institutional confidence. Analysts like Quinn Thompson of Lekker Capital argue that ETF-driven demand will "catch up to gold," with BitcoinBTC-- potentially reaching $150,000 by year-end, according to a CoinDesk article.
Technical Indicators: A Mixed Bag of Signals
Bitcoin's technical picture is a tug-of-war between bullish and bearish forces. The Relative Strength Index (RSI) currently sits at 47.88, indicating neutral momentum, as noted in a Blockchain.news report. The MACD remains flat, signaling indecision, and volume has declined sharply, suggesting waning conviction in both upward and downward moves (the Blockchain.news report also outlines these metrics).
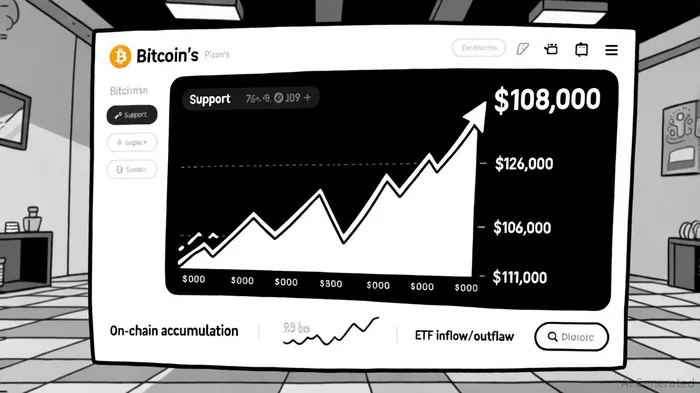
Key support levels are critical. The 200-day EMA at $111,000 acts as a psychological floor (Blockchain.news), and a break below $106,000 could trigger a retest of $100,000 (Yahoo Finance). Conversely, a rebound above $121,000 could reignite bullish momentum toward $125,000 (Blockchain.news). The Stochastic oscillator hints at a potential rebound to $120,000, but overbought conditions persist (CoinDesk).
Historical data on support-level events offers further context. A backtest of 60-day support-level breaches from 2022 to 2025 reveals 20 such events, with an average 5-day post-event excess return of +1.3 percentage points over a buy-and-hold strategy (Blockchain.news). While this effect is not statistically significant, the win rate improves from ~55% on day 1 to ~74% by day 14, after which returns plateau and eventually converge with the benchmark by day 30 (Blockchain.news). This suggests that support-level bounces historically offer short-term opportunities but carry diminishing returns beyond three weeks.
Open Interest and Funding Rates: Institutional Confidence Amid Volatility
Bitcoin's futures open interest hit $45.3 billion by October 3, 2025, reflecting robust institutional participation (CoinDesk). Elevated funding rates in perpetual futures markets also suggest aggressive long positioning (Yahoo Finance). While these metrics indicate confidence, they also amplify risks: a sharp price reversal could trigger cascading liquidations.
The Macro Picture: Dovish Policy vs. Regulatory Uncertainty
The U.S. dollar's weakening trend and the Federal Reserve's dovish stance remain tailwinds for Bitcoin (Markets FinancialContent). However, regulatory headwinds-particularly in the U.S.-pose a wildcard. Overbought conditions and geopolitical tensions (e.g., U.S.-China trade escalations) could reignite volatility (Analytics Insight).
Conclusion: A Precipice of Opportunity or Crisis?
Bitcoin's correction has exposed both strengths and vulnerabilities. On-chain accumulation and institutional demand suggest a bullish bias, but technical breakdowns below key supports could validate bearish scenarios. For now, the market is in a neutral phase, with the 200-day EMA and ETF flows serving as critical barometers.
Investors must weigh the risks:
- Buy-point scenario: Accumulation by smaller holders and ETF inflows indicate a potential bottoming process (Yahoo Finance).
- Crisis scenario: A break below $106,000 could trigger a deeper correction toward $100,000 (Yahoo Finance).
As the market digests these dynamics, patience and position sizing will be key. The coming weeks will test whether this correction is a "buy-the-dip" moment or a harbinger of a larger downturn.


Comentarios
Aún no hay comentarios