
Bitcoin's $113K Correction: Strategic Entry Points Amid Volatility
Bitcoin's recent drop below $113,000 has triggered a wave of panic, with over $1.7 billion in leveraged long positions liquidated in 24 hours[1]. While the broader crypto market has contracted to $3.89 trillion[2], this correction aligns with historical patterns and presents a unique opportunity for disciplined investors. By analyzing technical indicators, on-chain metrics, and investor sentiment, we can identify strategic entry points amid the volatility.
Market Context: A Correction in a Bull Cycle
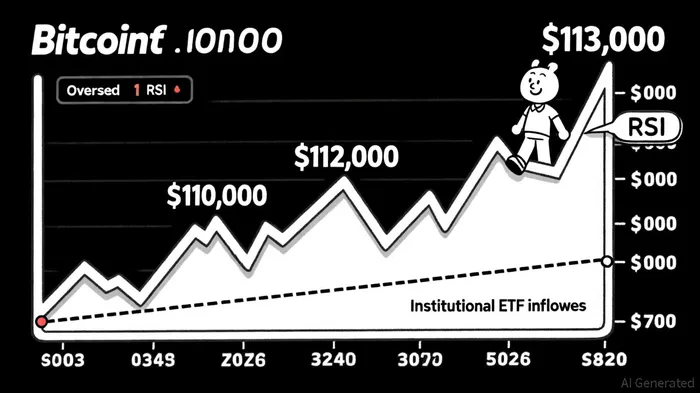
Bitcoin's decline below the critical $115,000 support level[4] has reignited bearish narratives, yet the broader picture remains bullish. The asset is still trading above its 200-day moving average—a key indicator of long-term strength—and institutional ETF inflows continue to defy short-term weakness[1]. Historically, September has been a weak month for BitcoinBTC--, but macroeconomic tailwinds, including Federal Reserve rate cuts and a weaker U.S. dollar, could catalyze a rebound[5].
This correction mirrors past bearish phases, such as the 2018 crash (from $19,533 to $3,200) and the 2022 bear market (77% decline over 12 months)[3]. In each case, investor sentiment metrics like the Crypto Fear & Greed Index and Bitcoin Misery Index (BMI) signaled oversold conditions before rebounds. Today, the Fear & Greed Index is near “Extreme Fear” levels (0–25), a contrarian signal historically correlated with price recoveries[6].
Strategic Entry Points: Technical and On-Chain Signals
- Support Levels and Fibonacci Retracements
- Immediate support sits at $112,000 and $110,000[4]. A breakdown below $105,000 could retest the $100,000 level, but historical data suggests these dips often attract accumulation[5].
- Fibonacci retracement levels at 50% ($111,500) and 61.8% ($110,000) act as psychological barriers. A bounce from these levels could validate a bullish reversal.
RSI indicators showing oversold conditions (below 30) have historically signaled short-term buying opportunities[1].
On-Chain Metrics
- The MVRV Z-Score, which measures overvaluation, has normalized after peaking near 7 in late 2024[3]. A score below 3 indicates undervaluation, suggesting a potential bottom.
Percent of Supply in Profit (PSiP) has dropped to 30%, indicating widespread capitulation. Historically, PSiP below 20% has marked bottoms[3].
Dollar-Cost Averaging (DCA) and Institutional Accumulation
- DCA strategies near $111,900 and high-conviction buys below $100,000 are optimal[2]. Institutional players, including Michael Saylor and El Salvador's government, have added to positions during dips[3].
- Whale activity has surged to multi-year highs, often preceding major price shifts[2].
Investor Sentiment: Fear as a Catalyst
Bitcoin's price is inextricably linked to investor sentiment. Studies show a robust correlation between rising sentiment and price increases, even when controlling for macroeconomic variables[7]. During the 2022 bear market, the BMI hit extreme bearish levels (below 27), signaling oversold conditions[1]. Today's sentiment mirrors this, with retail demand at historic lows but institutional demand intact[5].
The Fear & Greed Index has historically predicted recoveries when below 42[6]. For example, during the 2020 “Black Thursday” crash, the index hit “Extreme Fear,” followed by a 200% rebound in six months. Similar dynamics could unfold here.
Macro Tailwinds and the Halving Effect
The 2024 halving event (April 2024) reduced Bitcoin's supply, historically triggering bull markets. Post-halving cycles have delivered 150–400% returns[5]. With the next halving still over a year away, the current correction could be a pre-halving accumulation phase.
Federal Reserve rate cuts and a weaker dollar also favor Bitcoin. As a non-yielding asset, Bitcoin benefits from lower opportunity costs when interest rates decline[5].
Conclusion: Volatility as an Opportunity
Bitcoin's $113,000 correction is a test of conviction for long-term investors. While the short-term outlook is uncertain, historical patterns and on-chain data suggest this dip is a strategic entry point. By combining technical analysis, sentiment metrics, and macroeconomic insights, investors can navigate volatility with discipline.
As always, risk management is critical. Position sizing, stop-loss orders, and a focus on long-term fundamentals will separate winners from losers in this cycle.


Comentarios
Aún no hay comentarios