
Bitcoin’s $110K Price Battle: Is This the Pre-Rally Accumulation Zone or the Precursor to a Correction?
Bitcoin’s $110,000 level has emerged as a psychological and technical fulcrum in 2025, with bulls and bears locked in a high-stakes battle that could define the asset’s trajectory for the remainder of the year. This price zone, historically a magnet for volatility, now sits at the intersection of critical technical indicators, on-chain dynamics, and macroeconomic tailwinds. The question for investors is whether this consolidation represents a pre-rally accumulation phase or a warning sign of an impending correction.
Technical Indicators: Mixed Signals Amid a Critical Crossroads
Bitcoin’s price action near $110,000 reveals a tug-of-war between bullish momentum and bearish caution. The Relative Strength Index (RSI) currently stands at 63.178, signaling a buy signal as it hovers above the 50 threshold [2]. Meanwhile, the Moving Average Convergence Divergence (MACD) remains positive at 2,198.27, though the signal line at 496.45 suggests weakening bullish momentum [1]. This divergence—where price remains above key moving averages but momentum indicators show fatigue—points to a potential inflection pointIPCX--.
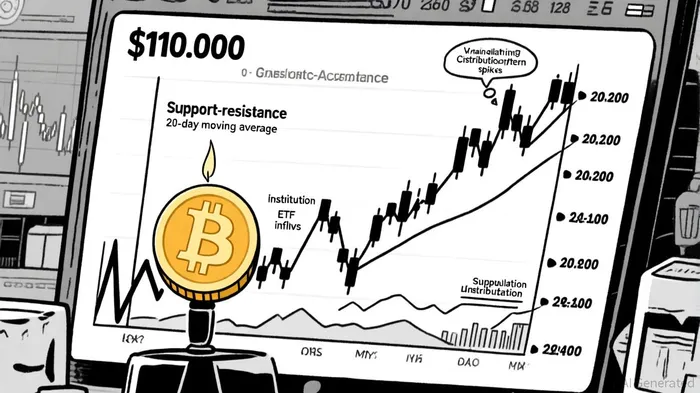
The 20-day moving average, at $116,194, acts as a critical resistance level. Bitcoin’s current price below this threshold indicates short-term bearish pressure [1]. However, a breakout above $115K–$116K could trigger a retest of the $110K level as support, potentially setting the stage for a parabolic rally toward $150K and beyond [1]. Conversely, a breakdown below $105K could trigger cascading liquidations, with further downside risks to $100K [1].
A bearish Head & Shoulders pattern has also emerged as a cautionary signal, with the right shoulder forming near $110K [1]. If this pattern completes, it could validate a correction toward $100K. However, such patterns often fail, particularly in markets with strong institutional underpinnings.
On-Chain Metrics: Accumulation vs. Distribution
On-chain data paints a nuanced picture of market sentiment. The Network Value to Transactions (NVT) Ratio has declined 11% to 33.8, indicating weakening transactional strength relative to Bitcoin’s valuation [1]. This divergence suggests that while the price remains elevated, on-chain activity has not fully justified the valuation, creating a potential overhang.
Whale activity, however, tells a different story. Over the past months, large holders have absorbed $3 billion worth of BitcoinBTC--, reinforcing long-term bullish sentiment [1]. Yet, September 2025 saw a significant selloff, with whales offloading 112,000 BTC ($12.7 billion) in a single month [4]. This profit-taking, while bearish in the short term, may clear overhead supply for a subsequent rally.
Exchange reserves have also fallen to multi-year lows, down 18.3% year-over-year [3]. This reduction in available supply on exchanges suggests that fewer coins are sitting idle for selling, potentially tightening the market’s supply curve. Institutional demand, meanwhile, remains robust, with Bitcoin ETFs attracting $54 billion in lifetime inflows [2]. These structural buyers could offset whale-driven volatility, particularly if macroeconomic conditions improve.
Macro Tailwinds and the Halving Narrative
The broader macroeconomic landscape remains a wildcard. Weak U.S. labor data and expectations of a Federal Reserve rate cut in mid-September have created a “risk-on” environment favorable to Bitcoin [5]. Historically, dovish monetary policy and falling real yields have driven capital into Bitcoin as a hedge against inflation [5].
The 2024 halving further amplifies bullish sentiment by reducing new supply, creating a potential supply shock [1]. Analysts argue that this structural shift, combined with institutional adoption, could set the stage for a $200K–$250K rally if Bitcoin convincingly clears $150K [1]. However, this scenario hinges on bulls maintaining control of the $110K–$115K range.
Conclusion: A High-Stakes Psychological Battle
Bitcoin’s $110K level is more than a price tag—it’s a battleground. Technical indicators suggest a fragile equilibrium, with RSI and MACD signaling mixed signals. On-chain metrics reveal a tug-of-war between whale distribution and institutional accumulation. Macro factors, meanwhile, offer both tailwinds and headwinds.
For now, the market appears to be in a pre-rally accumulation phase, with whales and institutions balancing short-term profit-taking against long-term bullish conviction. A decisive breakout above $115K could validate the halving-driven bull case, while a breakdown below $105K would test the resilience of the $100K support. Investors must closely monitor on-chain activity, whale behavior, and Fed policy as the next chapter unfolds.
**Source:[1] Bitcoin (BTC) Price Prediction: Bitcoin Eyes $200K Rally [https://bravenewcoin.com/insights/bitcoin-btc-price-prediction-bitcoin-eyes-200k-rally-after-rebounding-strongly-from-110k-support][2] Can 2025 Defeat the Crypto September Curse? [https://beincrypto.com/september-is-the-worst-month-for-crypto/][3] Bitcoin vs. Ethereum: What Makes September 2025 ... [https://www.bitget.com/news/detail/12560604948719][4] Bitcoin Whales Dump $12.7B In Largest Selloff Since 2022 [https://cointelegraph.com/news/bitcoin-whales-dumped-115000-btc-largest-selloff-since-mid-2022][5] Bitcoin (BTC-USD) Holds $110K as ETF Flows, Fed Policy [https://www.tradingnews.com/news/bitcoin-price-forecast-holds-110k-usd]


Comentarios
Aún no hay comentarios