
Binance Coin's Meteoric 62% Rally: Is Now the Time to Buy or Sell?
The 62% Rally: Technicals Suggest a Bullish Foundation, But Profit-Taking Risks Loom
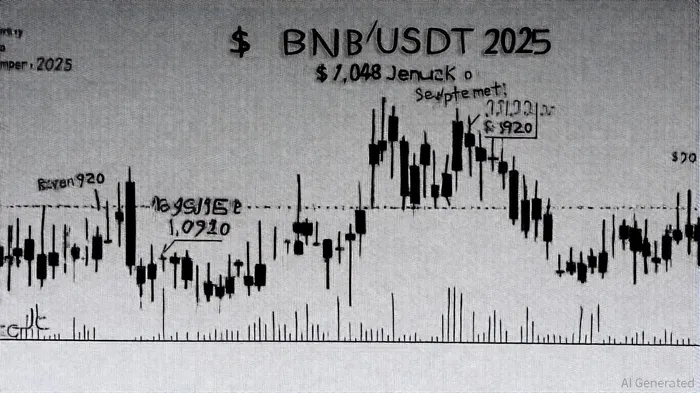
Binance Coin (BNB) has surged 62% year-to-date, hitting a record $1,048 on September 19, 2025[1]. This meteoric rise is driven by a confluence of technical strength, institutional adoption, and robust on-chain activity. However, the question remains: Is this a buying opportunity or a warning sign of overbought conditions?
Technical Analysis: A Cup-and-Handle Pattern with Overbought RSI
BNB's price action in September 2025 forms a textbook cup-and-handle pattern, a bullish continuation formation[2]. The pattern's target price of $1,250–$1,565 by year-end aligns with Fibonacci extensions and the 50- and 200-day SMAs, which currently sit at $974 and $851, respectively[2]. The Relative Strength Index (RSI) has pushed into overbought territory (82 on the 4H chart), signaling short-term exhaustion[3].
Yet, the MACD histogram remains bullish, and BNB's position above all major moving averages suggests the long-term trend is intact[4]. A critical test lies ahead: If BNBBNB-- breaks above $945, it could trigger a momentum-driven rally toward $1,000+ by year-end[4]. Conversely, a drop below $920 or $840 could trigger a correction, with the 0.236 Fibonacci retracement at $1,012 acting as a near-term support level[2].
On-Chain Metrics: Ecosystem Growth vs. Profit-Taking Pressures
BNB Chain's on-chain metrics tell a story of explosive growth. Daily active addresses surged 28% to 1.3 million, while transaction volume hit a four-day peak of 16 million[5]. Institutional adoption, including Nano Labs' $1 billion BNB purchase and Binance's Franklin Templeton partnership, further bolsters fundamentals[2].
However, profit-taking risks are evident. A 71,861 BNB whale sale (valued at $71 million) in early September reignited bearish speculation[6]. Meanwhile, the NUPL (Net Unrealized Profit/Loss) indicator rose above $600, reflecting mid-cycle optimism but also hinting at potential profit-taking as holders lock in gains[2]. Exchange inflows and outflows have spiked, with $7.6 million in net inflows into custodial wallets, suggesting a tug-of-war between accumulation and short-term trading[1].
Profit-Taking Ratio: A Hidden Risk in the Data
While the exact percentage of BNB holders in profit remains unquantified, on-chain behavior implies significant profit-taking. For instance, BNB's price dropped 4% in early September after breaking through $872.81 resistance, as traders cashed in gains[7]. The token's 4.5% annualized deflation rate (via burns) has reduced its circulating supply to 139.3 million, but whale activity—such as the 7-year-dormant whale's $71 million sell-off—highlights structural risks[8].
The Verdict: Buy the Dip or Sell the Rally?
BNB's technicals paint a bullish picture, with a strong cup-and-handle pattern and institutional tailwinds. However, on-chain data reveals a market teetering between accumulation and profit-taking. For risk-tolerant investors, a pullback to $920–$900 could present a compelling entry point, aligning with the 50-EMA and Fibonacci support[2]. Conversely, those wary of overbought conditions might prefer to wait for a clearer breakout above $945 or a consolidation phase.
Key Risks to Monitor:
- A breakdown below $840 could trigger a deeper correction.
- Whale selling pressure, particularly if large holders continue to offload.
- Regulatory headwinds or macroeconomic shifts (e.g., Fed policy).
In the end, BNB's trajectory hinges on whether the current rally is a sustainable bull run or a short-term overextension. For now, the data leans bullish—but not without caveats.


Comentarios
Aún no hay comentarios