
Barclays' Equity Euphoria Indicator: A New Lens for Market Timing in Euphoric Conditions
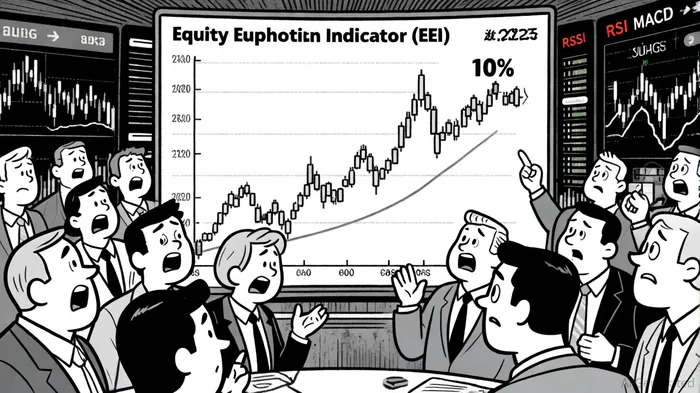
Barclays' newly introduced Equity Euphoria Indicator (EEI) has emerged as a critical tool for gauging investor sentiment in equities, particularly during periods of speculative fervor. Designed to analyze derivatives flows-including volatility technicals and option flows-the EEI quantifies the intensity of market exuberance, offering a unique perspective on crowd behavior. As of mid-2025, the indicator has reached 10.7%, a level last seen during the dot-com bubble of the early 2000s and the meme stock frenzy of 2020–21, according to The Financial Analyst. This raises a compelling question: How can investors leverage the EEI alongside traditional technical indicators like the Relative Strength Index (RSI) and Moving Average Convergence Divergence (MACD) to time equity market entries and exits?
The EEI as a Sentiment Barometer
The EEI's methodology focuses on derivatives activity, which often precedes price movements. For instance, a surge in call overwriting and gamma supply from buy-write funds signals crowded bullish positions, while increased demand for downside protection in options markets hints at impending volatility, as reported by Investing.com. Historically, the EEI has averaged around 7%, with peaks above 10% occurring in less than 20% of cases. These rare spikes have consistently coincided with market corrections, as GoldSilver notes.
Barclays analysts caution that current euphoric conditions-driven by AI optimism, deregulation, and post-election positioning-mirror past bubbles. For example, the 2020–21 meme stock rally saw the EEI spike to similar levels, followed by sharp reversals as fundamentals failed to justify valuations, as reported by Yahoo Finance. This pattern underscores the EEI's potential as a contrarian signal: when euphoria peaks, caution is warranted.
Integrating EEI with Technical Indicators
While the EEI captures sentiment, traditional technical indicators like RSI and MACD focus on price action. Combining these tools can enhance market timing strategies.
RSI and Overbought Conditions
The RSI measures momentum by comparing recent gains to losses. During euphoric periods, RSI often enters overbought territory (above 70), signaling potential exhaustion. For example, during the 2020–21 meme stock rally, RSI readings for stocks like GameStop (GME) and AMC frequently exceeded 80, aligning with EEI peaks, according to an RSI study. A trader might use this as a sell signal, especially if the EEI also indicates extreme euphoria.MACD and Divergence Alerts
The MACD tracks momentum shifts by comparing two moving averages. In euphoric markets, price highs may outpace MACD highs, creating bearish divergences. For instance, during the dot-com bubble, the S&P 500's MACD began to lag in late 1999 despite rising prices-a warning sign that the EEI later confirmed, as shown in a MACD analysis.Synergistic Use Cases
A hypothetical strategy might involve:- Entry Points: Buying when the EEI is below 7% (normal sentiment), RSI is oversold (below 30), and MACD is bullish (positive crossover).
- Exit Points: Selling when the EEI exceeds 10%, RSI is overbought, and MACD shows bearish divergence.
During the 2020–21 meme stock frenzy, such a strategy could have captured gains in early 2021 while exiting before the collapse in March 2021, according to InvestorsHangout.
Historical Lessons and Risks
The 2000 dot-com crash and 2021 meme stock collapse illustrate the risks of ignoring sentiment indicators. In both cases, the EEI flagged extreme euphoria months before corrections. For example, in late 1999, the EEI reached 10.5%, while the S&P 500's RSI hit 85-a combination that historically predicts overvaluation, as reported in an InvestorsHangout piece. Similarly, in early 2021, the EEI spiked alongside RSI readings for meme stocks, signaling a crowded trade.
However, technical indicators alone can be misleading. A 2023–2024 study found that RSI had 97% accuracy in short-term trading, while MACD lagged at 52%, according to Barclays Private Bank. This suggests that RSI is better suited for identifying overbought/oversold conditions, whereas MACD excels in trend analysis. Combining these with the EEI's sentiment insights could mitigate false signals.
Conclusion: A Holistic Approach to Market Timing
Barclays' EEI offers a novel lens for assessing market psychology, but its true power lies in integration with traditional tools. By combining the EEI's crowd-behavior insights with RSI's momentum analysis and MACD's trend tracking, investors can build robust strategies for navigating euphoric markets. As the 2025 EEI reading suggests, caution is warranted-especially when technical indicators also signal overbought conditions. In an era of AI-driven speculation and geopolitical uncertainty, a multi-faceted approach may be the key to avoiding the next bubble burst.
```

Comentarios
Aún no hay comentarios