
Analyzing On-Chain ETH Positioning: A Strategic Play on Long-Term Bullish Sentiment in 2025
The On-Chain Case for Ethereum: Decoding 2025's Bullish Potential
Ethereum's on-chain metrics have long served as a barometer for market sentiment, offering insights into investor behavior and price trajectory. In 2025, these indicators—particularly Net Unrealized Profit/Loss (NUPL), Spent Output Profit Ratio (SOPR), and Realized Price-to-Liveliness Ratio (RPLR)—paint a nuanced picture of a market at a crossroads. While some signals suggest bearish divergence, others reinforce a compelling case for long-term bullish conviction.
1. NUPL: From Capitulation to Conviction
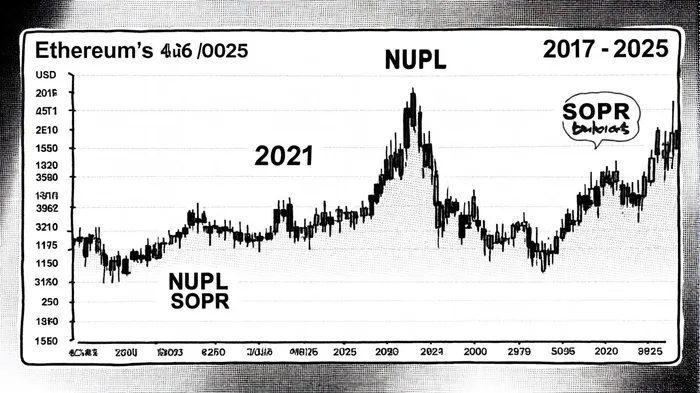
The NUPL metric, which aggregates unrealized gains and losses across all EthereumETH-- holders, has historically marked critical turning points. During the 2017 and 2021 bull cycles, NUPL values above 0.7 signaled euphoric market tops[1]. For instance, in January 2017, Ethereum's NUPL hit 0.934, while in May 2021, it peaked at 0.75[2]. These levels often preceded sharp corrections, as profit-taking overwhelmed buyer demand.
However, 2025's NUPL tells a different story. As of Q3 2025, the metric has dipped below 0.5, entering the “capitulation” zone—a pattern historically associated with market bottoms[3]. A similar dip in 2024 was followed by a 20% price rebound[3], suggesting Ethereum may be nearing a cyclical inflection pointIPCX--. This divergence from 2017/2021 patterns hints at a shift in investor psychology, where long-term holders (LTHs) are accumulating at lower prices.
2. SOPR: Profit-Taking vs. Forced Liquidations
The SOPR metric, which measures whether coins are spent at a profit or loss, further clarifies Ethereum's positioning. In bull markets, SOPR values above 1 indicate widespread profit-taking, while values below 1 signal distress. During the 2017 and 2021 cycles, SOPR consistently remained above 1, reflecting strong buyer demand[4].
In 2025, however, SOPR has fallen below 1, indicating that holders are selling at a loss[5]. This bearish signal aligns with the RPLR's breakdown below its trend line—a historical indicator of bull cycle exhaustion[5]. Yet, this does not negate long-term optimism. Long-term holders (those holding ETH for >155 days) have accumulated 22.5% more tokens since March 2025, lowering their cost basis during dips[6]. This accumulation suggests structural demand, driven by institutional inflows into Ethereum spot ETFs and staking activity[6].
3. Technological Tailwinds: EIP-1559 and Layer 2
Ethereum's post-merge dynamics, including EIP-1559 and Layer 2 scaling solutions, have fundamentally altered its tokenomics. EIP-1559's deflationary base fee burn mechanism has reduced ETH issuance, tightening supply-demand dynamics[7]. Meanwhile, Layer 2 solutions like ZK Rollups have shifted high-frequency transactions off-chain, reducing on-chain congestion and skewing metrics like MVRV (Market Value to Realized Value)[7].
These upgrades have created a flywheel effect: lower fees attract more users, which drives network activity and staking demand. As of May 2025, 59% of Ethereum holders were in profit at $2,459, reflecting growing confidence in the asset's utility and scarcity[8].
4. Macro and Market Catalysts
Beyond on-chain metrics, macroeconomic factors and institutional adoption bolster Ethereum's case. The Federal Reserve's anticipated rate cuts in 2025 could boost risk assets like ETH, while Ethereum's technical setup—a multi-year ascending triangle pattern—suggests a potential breakout above $7,000[9]. Analysts from major institutions project a price range of $7,000–$10,000, contingent on continued adoption and successful scaling[9].
Strategic Implications for Investors
While on-chain metrics highlight near-term bearish pressures, they also underscore Ethereum's structural strengths. The interplay between forced liquidations (SOPR < 1) and accumulation (LTH buying) creates a “buy-the-dip” dynamic, historically preceding bull market resurgences. Investors should monitor key levels:
- NUPL > 0.5: A potential reversal signal.
- SOPR > 1: A sign of renewed profit-taking.
- RPLR retesting trend line: A bullish breakout candidate.
Pairing these signals with macroeconomic catalysts (e.g., Fed policy shifts) and technological milestones (e.g., Dencun upgrades) offers a robust framework for strategic entry.


Comentarios
Aún no hay comentarios