
Altcoin Recovery Amid Major Liquidation Events: Strategic Entry Points in Ethereum and XRP Post-Liquidation Volatility
The cryptocurrency market's recent turbulence in late October 2025, marked by a $16 billion liquidation of leveraged long positions, has left EthereumETH-- (ETH) and XRPXRP-- in a precarious yet potentially strategic position for recovery. As the dust settles, traders and investors are scrutinizing technical and on-chain signals to identify entry points amid the volatility. This analysis explores the post-liquidation dynamics of ETHETH-- and XRP, leveraging historical patterns, technical indicators, and institutional sentiment to outline actionable strategies.
The Aftermath of the October 2025 Liquidation Event
A cascading sell-off triggered by over-leveraged positions wiped out $610 million in bullish XRP bets alone, sending its price to a low of $2.44 before stabilizing at $2.60 within days, according to a Currency Analytics report. Ethereum, similarly impacted, saw gas fees normalize and prices rebound from recent troughs, though its recovery remains contingent on Bitcoin's broader performance, as noted in a Coinotag analysis. The crash exposed systemic fragility in leveraged altcoin markets, yet it also created opportunities for disciplined investors.
Open interest (OI) for XRP plummeted from $2.8 billion to $1.4 billion as traders exited positions, while funding rates normalized, signaling easing bearish momentum (reported by The Currency Analytics). For Ethereum, OI stabilization and reduced selling pressure, as indicated by on-chain accumulation by long-term holders, suggest a potential floor to the downturn (see Coinotag's on-chain notes). Analysts emphasize that recovery phases typically involve three stages: market bleeding, data feed stabilization, and absorption of large sell orders by market makers, according to a CoinDesk article.
Strategic Entry Points: Technical and On-Chain Signals
Ethereum (ETH)
Ethereum's price is currently testing key resistance at $2,500, with a breakout expected to target $3,000, according to a QuantifiedStrategies study. Technical indicators show mixed signals: the 14-day RSI (68) suggests near-overbought conditions, while the 144 SMA (down 2.68%) reflects bearish medium-term trends, as outlined in an Analytics Insight piece. However, the 10-day EMA remains bullish, creating a divergence that could signal a trend reversal (noted in the CoinDesk coverage).
Historical RSI patterns for Ethereum have shown a high success rate in mean-reverting markets when combined with moving averages (see the QuantifiedStrategies study). However, a backtest of buying ETH when RSI(14) exceeds 70 and holding for 30 trading days from 2022 to 2025 reveals a more nuanced picture: while the win rate oscillates near 52–55% and average excess return is approximately +1% over BTC, the edge is marginal and statistically insignificant. The strongest performance emerges around day 8–9 post-signal, after which returns tend to fade. Institutional flows, such as ETF inflows, further bolster the case for ETH, as seen in past cycles and discussed in an altFINS analysis.
XRP
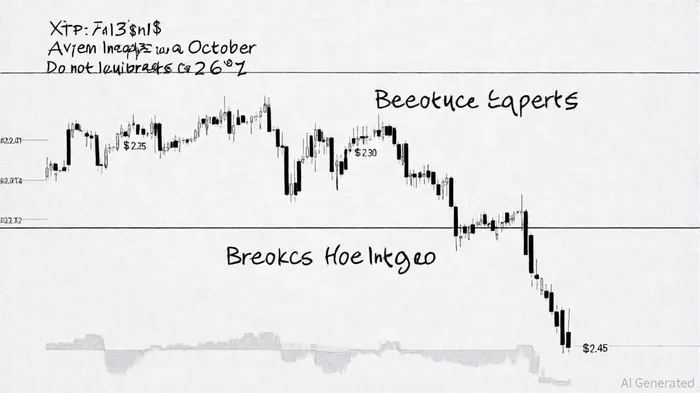
XRP's falling wedge pattern, forming since early May 2025, has narrowed to a critical juncture near $2.30–$2.45 (see the Analytics Insight coverage). A breakout above $2.45 could drive the price toward $2.61–$2.72, with a 64% historical success rate for falling wedge patterns in altcoins (per altFINS data). On-chain data, including rising open interest and network activity, supports growing confidence in XRP's bullish case (as highlighted in Coinotag's analysis).
Analysts like EGRAG CRYPTO note that XRP is transitioning from a "grinding phase" to a potential breakout, with repeated tests of the $2.30 support level likely before a decisive move (reported by The Currency Analytics). A breakdown below $2.03, however, would invalidate the bullish scenario, emphasizing the need for tight risk management.
Historical Success Rates and Risk Mitigation
While no direct five-year success rates for ETH/XRP strategies are available, general principles apply. The RSI trading strategy, with a strong historical win rate in equities, can be adapted to cryptocurrencies by combining it with moving averages and volume analysis (see the QuantifiedStrategies study). For example, Ethereum's RSI crossing above 70 (overbought) while the 8 SMA rises 1.14% could signal a short-term rally (noted in the Analytics Insight coverage).
Falling wedge breakouts, though not XRP-specific, have a 68% success rate in historical data per altFINS. This aligns with XRP's 2025 pattern, which mirrors pre-2017 and 2020 rallies (as observed in Coinotag's write-up). However, external risks-such as U.S.-China trade tensions and weekend liquidity challenges-could prolong the bottoming process (outlined in the CoinDesk article).
Data Visualization and Market Dynamics
Conclusion: Balancing Caution and Opportunity
The post-liquidation environment for ETH and XRP presents a duality: fragility in leveraged markets coexists with emerging technical and on-chain resilience. For Ethereum, a breakout above $2,500 with confirmation from EMAs and RSI could signal a sustained recovery. XRP's falling wedge pattern, if validated, offers a high-probability entry near $2.30, with clear risk-reward parameters.
Investors should prioritize strict stop-losses, monitor macroeconomic conditions, and consider institutional flows as catalysts. While the road to recovery may be gradual, disciplined strategies rooted in technical analysis and historical success rates offer a roadmap to navigate the volatility.


Comentarios
Aún no hay comentarios