
Catch pre-market movers with AI signals.
Mina Spikes on Volume But Fails to Break Resistance
Summary
- Mina/USDC trades near 0.0881 amid volatile 24h sessions.
- Volume spikes on September 9 failed to sustain upward momentum.
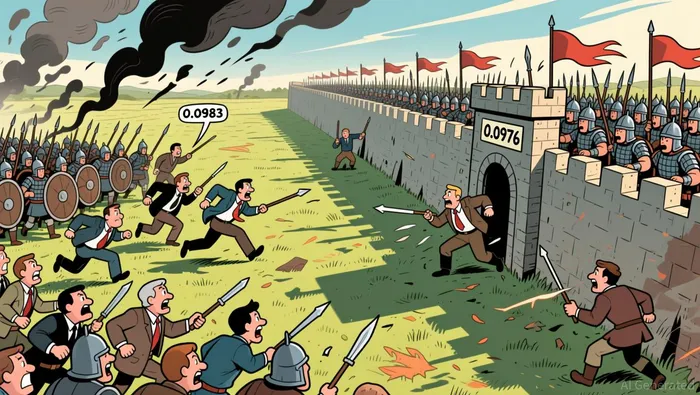
- Key resistance at 0.0976 shows repeated rejection with long upper shadows.
- Support holds near 0.0883 as buyers attempt to reclaim levels.
- Market structure suggests consolidation following recent significant upward moves.
Volatile Consolidation
Mina/USDC (MINAUSDC) closed the latest hour at 0.0881. The 24-hour total volume reached approximately 1,182,000 tokens, reflecting active trading interest. Price action indicates a struggle between buyers testing higher levels and sellers defending key support zones.
1-Hour Support/Resistance and Candlestick Patterns
The market structure indicates a range-bound environment with price currently positioned closer to immediate support levels. The recent high of 0.0976 on September 9 served as a strong resistance zone, characterized by multiple long upper shadow candles that suggest significant selling pressure at those heights. Specifically, the hour ending at 15:00 on September 9 and 18:00 on September 9 both exhibited long upper shadows, where the wick length was at least twice the body length, signaling rejection of higher prices. Conversely, support appears to be forming around the 0.0883 level, where the price found a floor during the early hours of September 10. The candle pattern at 16:00 on September 9 displayed a bullish engulfing pattern, where the body fully covered the prior candle, providing temporary upward momentum. However, the subsequent hours saw a mix of doji and bearish engulfing patterns, particularly at 11:00 on September 10, indicating indecision and potential downward pressure. The current price of 0.0881 is testing the lower boundary of the recent trading range, suggesting that immediate support is critical for any further upside.
Volume and Turnover vs. Historical Comparison
The 24-hour trading volume for MINAUSDC was approximately 1,182,000 tokens. This figure is slightly above the 15-day average daily volume of 804,627 tokens but lower than the 7-day average daily volume of 869,508 tokens when normalized for the shorter period, indicating a moderate increase in activity compared to the longer term but a decrease relative to the immediate week. The 7-day average single-hour volume is roughly 36,230 tokens. Significant volume spikes occurred at 16:00, 17:00, and 20:00 on September 9, with volumes of 178,415, 252,357, and 132,757 tokens respectively, all exceeding two times the average hourly volume. Despite these high-volume events, the price did not sustain a strong breakout. For instance, after the massive spike at 17:00 on September 9, the price only briefly touched 0.0945 before retreating, showing a lack of follow-through. This suggests that the volume anomalies did not effectively drive a sustained price increase, but rather facilitated a redistribution of positions. The high volume at 21:00 on September 9 also resulted in a price decline, reinforcing the notion that selling pressure absorbed the buying interest during these peak volume hours.
Look Back: Current Market Phase
The market phase for MINAUSDC appears to be in a consolidation or sideways phase following a significant upward move. Over the past 7 days, the price has increased by approximately 18.1%, and over the past 3 days by about 5.9%. This substantial prior move exceeds the 15% threshold often associated with mean reversion scenarios. The recent price action, characterized by a series of lower highs and failed breakouts above 0.0976, suggests that the market is cooling off after the strong rally. The 15-day daily price range is 0.04, which, relative to the current price level, indicates a moderate range of fluctuation. The market structure feature is noted as a higher high, but the immediate price action shows rejection at these highs. This context suggests that the market is likely undergoing a mean reversion or correction phase, where prices consolidate before deciding on the next major direction. The absence of clear lower highs and lower lows over the very short term keeps the trend ambiguous, but the rejection from recent peaks points to a temporary pause in the uptrend.
The market may continue to consolidate in the near term, with price likely testing support levels around 0.0883. An upside risk exists if price breaks above 0.0976 with sustained volume, while a downside risk is present if support at 0.0883 breaks, potentially leading to further retrace towards 0.0875.

Decoding market patterns and unlocking profitable trading strategies in the crypto space







Kommentare
Noch keine Kommentare