
Catch pre-market movers with AI signals.
AXS Enters Sideways Consolidation as Mixed Momentum Signals Emerge
Axie Infinity (AXS) remains in a sideways trading pattern as of March 5, with mixed signals emerging from key technical indicators. The price currently sits at $1.27, below the 20-period exponential moving average (EMA20) of $1.37, which continues to exert bearish pressure despite bullish MACD readings. The Supertrend indicator remains bearish, reinforcing the need for confirmation from either volume or momentum before a breakout becomes likely.
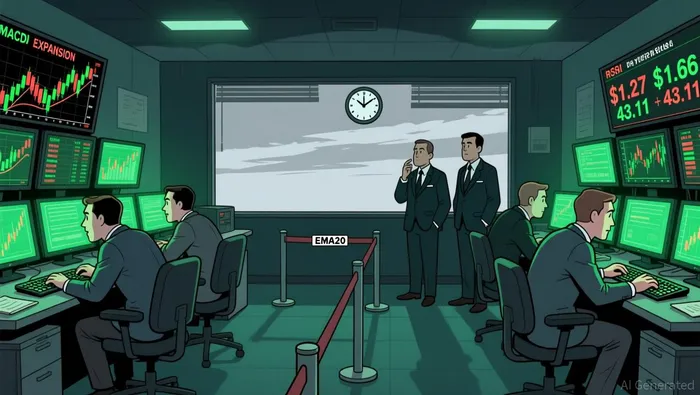
The Relative Strength Index (RSI) is in a neutral position at 43.11, neither overbought nor oversold, suggesting the market is indecisive in the short term. The MACD histogram shows expansion, indicating strengthening bullish momentum, but price remains below EMA20, which remains a significant bearish signal. This divergence between price and momentum highlights the uncertainty of the current phase.
The recent 180% rally to $2.54 has been followed by a correction, with price currently at $1.66 and RSI at 59.33. This level is below overbought territory, but bearish divergence is evident in RSI as it forms lower highs while price makes higher highs. The breakdown of this support could lead to a test of $1.50, while a hold would reaffirm the integrity of the uptrend.
What Drives the Sideways Movement in AXS?
The sideways movement in AXS is influenced by conflicting signals from multiple technical indicators. Price remains below the EMA20, which acts as a psychological barrier for bullish participants. However, the MACD is showing bullish expansion, suggesting latent buying pressure is building, although this is not yet reflected in price action. The Supertrend indicator adds bearish bias, reinforcing the idea that a breakout may still require higher volume or stronger accumulation.
Volume has been moderate, with a 24-hour trading value of $50.47M, which is insufficient to confirm a strong directional move. This suggests the market is in a state of consolidation rather than a breakout phase. Key resistance is identified at $1.72, a level that would need to be cleared to validate a bullish bias.
What Are the Immediate Risks for AXS?
The primary risk for AXS lies in its inability to hold key support levels and the potential for a deeper correction. A breakdown below $1.66 could lead to further downward pressure, testing the $1.50 level. This is supported by the 30-day simple moving average (SMA) and Fibonacci 61.8% retracement level, both of which act as crucial anchors. A failure to hold at $1.66 could trigger a broader bearish move, particularly if BitcoinBTC-- (BTC) continues its downtrend.
The correlation with Bitcoin remains strong, with BTC currently at $66,500 and facing key resistance at $68,134. A BTC breakdown could amplify downside pressure on AXS, especially if the altcoin fails to hold its own support at $1.2370. Additionally, the crypto Fear & Greed Index is at an extreme fear level of 14, which could exacerbate volatility and accelerate selling pressure.
The technical outlook for AXS remains cautious, with momentum indicators showing mixed signals. A decisive close above the 50-day SMA at $1.62 would be necessary to confirm a return to a bullish trend. Until then, traders are advised to monitor volume and price confluence for confirmation of a breakout, with key levels to watch being $1.66 on the downside and $1.72 on the upside.

Blending traditional trading wisdom with cutting-edge cryptocurrency insights.







Kommentare
Noch keine Kommentare