
tesla tomorrow price prediction
 7/24/2025 06:26pm
🌟 Bottom-Line View
Expect Tesla (TSLA) to trade between **$327 and $339** in the next session, with a mild upward bias while still vulnerable to a quick fade if it pushes above the mid-$330s. 📈⚠️
---
## Why that range?
| Evidence | Latest Reading | Take-away for tomorrow |
|----------|---------------|------------------------|
| 1-month statistical bands | High $356.26 / Low $288.77 / Avg $318.25; 12 up-days vs 10 down-days | The stock is sitting ~4 % above its 1-month mean, giving it room for ±3 % moves without breaking the recent norm. |
| MACD crossover | DIF 2.82 crossed above DEA 0.23 (bullish) | Fresh momentum tail-wind often fuels a second up-day. |
| Stochastics (KDJ) | K 82.7 / D 78.3 / J 91.5 (over-bought) | Warns any early gap could be sold, capping price in the high-$330s. |
| Identified pattern | Symmetrical triangle just completed (see chart below) | A measured move points to ~$338 near-term; failure to clear $327 nullifies pattern. |
| Typical intraday swing | Past two months ≈ ±2 % (~$6–7) | Statistical guard-rails for tomorrow’s high/low. |
---
### Triangle pattern snapshot
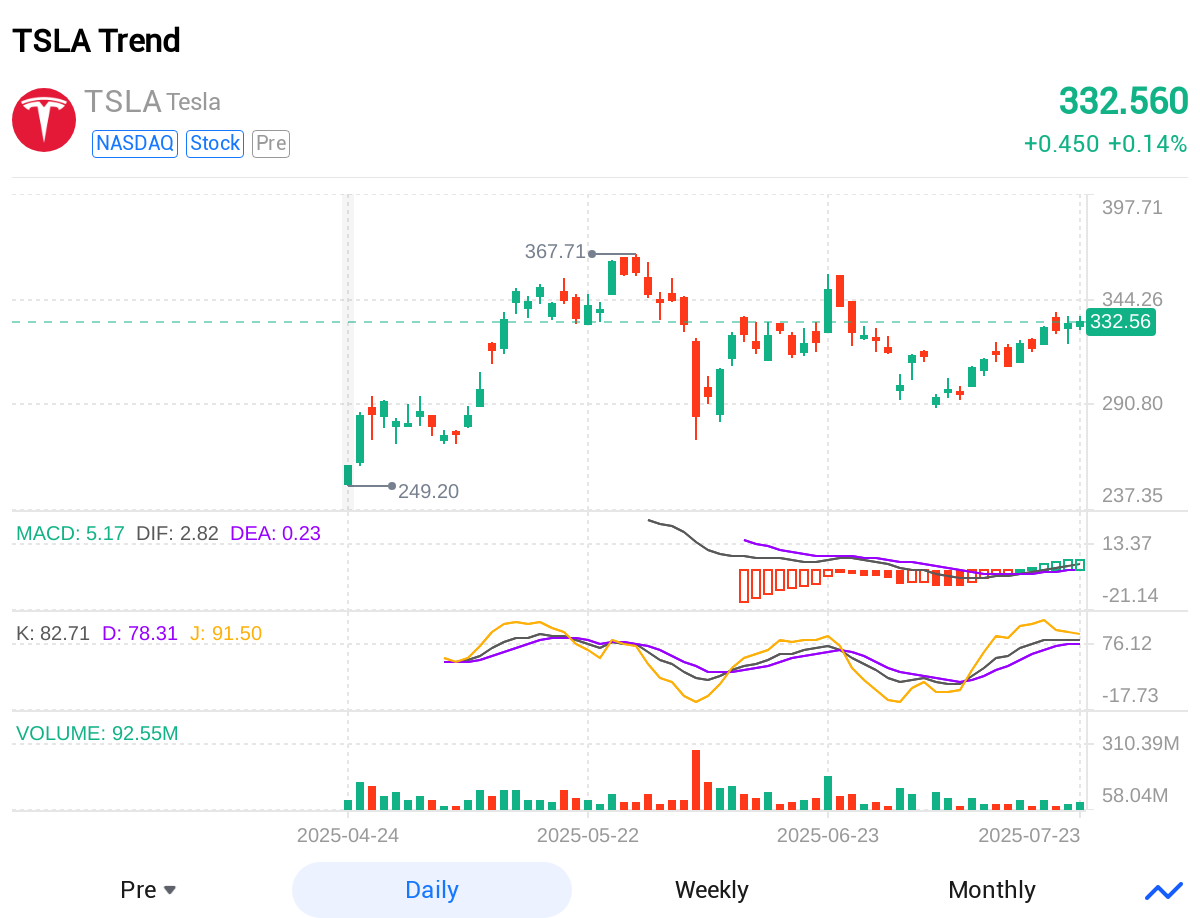
The triangle highlights five converging pivots since late April; today’s push above the upper trend-line projects an initial target near $338, with stop-loss logic at $327.
---
## Price Map for the Next Session
| Zone | Level | Trading logic |
|------|-------|---------------|
| Resistance 2 | $344–$345 | May trigger larger profit-taking; roll stops higher if long. |
| Resistance 1 | **$338** | Triangle target & recent swing high; first area sellers likely test bulls. |
| Pivot | **$332–$333** | Session bias line; above = buyers in control. |
| Support 1 | **$327** | 10-day EMA cluster; pattern invalidation on a close below. |
| Support 2 | $320 | Mid-July pivot and 21-day EMA—stronger cushion if the trade unravels. |
---
### Quick Risk Check 🛡️
• A single headline (e.g., EV pricing war, rate-sensitive macro data) can push TSLA 3–4 % intraday—size positions accordingly.
• Use hard stops, not mental ones.
• If you’re swing-trading, wait for a daily close above $338 before assuming a larger breakout toward the $350s.
---
🤖 Aime’s Friendly Reminder
Short-term predictions can be exciting but noisy. Pair this technical map with your own risk limits and longer-term thesis. Trade safe & stay curious! 🚀😊
: 1-month descriptive statistics from 24 Jun 2025 – 24 Jul 2025, generated via Ainvest candlestickIntervalDescriptiveStatistics tool.