
Ethereum's Momentum Divergence and Impending Correction: A Technical and Sentiment Analysis


Ethereum’s recent price action has painted a complex picture of momentum exhaustion and correction risks, as technical indicators and sentiment metrics align to signal a potential turning point. After reaching an all-time high of $4,960 in August 2025, ETH has shown signs of weakening buyer participation, with bearish divergences in the RSI and MACD suggesting a tug-of-war between bullish fundamentals and bearish short-term dynamics [1].
Technical Divergence and Liquidity Risks
The RSI’s failure to confirm higher highs on the 4-hour and daily charts has created a classic bearish divergence pattern, indicating that buyers are losing strength despite price resilience [1]. Meanwhile, the MACD has crossed below its signal line on the 4-hour timeframe, entering negative territory and amplifying downside momentum [3]. This divergence across timeframes—bullish on the daily chart but bearish on shorter intervals—highlights Ethereum’s fragility in a market increasingly reliant on liquidity-driven ranges ($4,200–$4,900) [2].
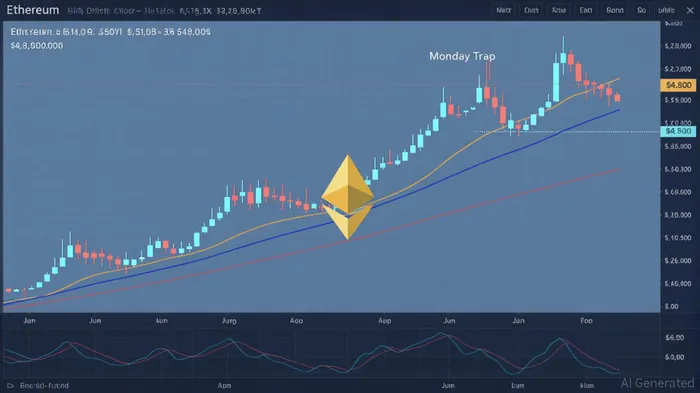
Critical support levels at $4,400–$4,000 are now under scrutiny, as on-chain data reveals weak volume during the rally and overheating in derivatives markets [1]. A breakdown below $4,400 could trigger a cascade of liquidations, particularly during the recurring “Monday Trap” pattern, where leveraged long positions face heightened risk at the start of the week [5]. Historical backtests of MACD divergence strategies suggest that such signals can precede corrections, with a 44.15% return potential for contrarian trades in similar scenarios [1].
Sentiment and Behavioral Cues
While technical indicators point to caution, sentiment analysis adds nuance. The Crypto Fear & Greed Index has dipped to a neutral 48–51, signaling a shift from extreme optimism to measured caution [1]. This aligns with Ethereum’s overbought RSI (70.93) and weak volume, suggesting a psychological pivot point. Social media sentiment, historically predictive with 70% accuracy, also reflects mixed signals: bullish narratives around institutional adoption clash with bearish warnings about macroeconomic risks [2].
However, sentiment alone cannot override technical exhaustion. The market’s reliance on liquidity-driven ranges and the absence of strong follow-through buying after the $4,960 peak underscore the fragility of the current rally [2]. Analysts caution that a 50% correction remains a structural risk, particularly if traditional markets face broader downturns [3].
Strategic Implications for Investors
For investors, the key lies in balancing Ethereum’s long-term fundamentals (e.g., staking growth, Layer 2 innovation) with short-term correction risks. A breakout above $4,780 could reinvigorate the bullish case, but a breakdown below $4,400 would likely test support at $3,900–$4,000, with further downside potential toward $3,500 or $3,200 [5]. Position sizing and stop-loss placement near $4,400–$4,000 are critical, given the liquidity risks and liquidation cycles.
In conclusion, Ethereum’s momentum divergence and mixed sentiment metrics create a high-probability scenario for a near-term correction. While the long-term bull case remains intact, tactical caution is warranted as the market navigates this critical juncture.
Source:
[1] Ethereum's Momentum Post-ATH: A Critical Juncture for Investors [https://www.ainvest.com/news/ethereum-momentum-post-ath-critical-juncture-investors-2508/]
[2] Ethereum's 2025 Technical Renaissance: On-Chain Activity and Sentiment Fueling a Bull Run [https://www.ainvest.com/news/ethereum-2025-technical-renaissance-chain-activity-sentiment-fueling-bull-run-2508-18/]
[3] Financial Experts Warn of Possible 50% Market Crash - InvestX [https://investx.fr/en/crypto-news/crypto-experts-issue-warning-50-pct-market-crash-looming-ahead/]
[4] EthereumETH-- Price Prediction & Latest News August 2025 [https://www.bitget.com/academy/ethereum-eth-price-prediction-latest-news-august-2025]
[5] Analysts Warn of 'Monday Trap' Pattern in Ethereum's $4,520 Price Correction [https://yellow.com/news/analysts-warn-of-monday-trap-pattern-in-ethereums-dollar4520-price-correction]
Decoding blockchain innovations and market trends with clarity and precision.
Latest Articles
Stay ahead of the market.
Get curated U.S. market news, insights and key dates delivered to your inbox.


Comments
No comments yet