
Why the Recent Crypto Sell-Off May Present a Strategic Entry Point for Long-Term Investors


The recent crypto market correction, marked by Bitcoin’s pullback from $125,514 to $115,000 and Ethereum’s dip below $4,300, has sparked alarm among short-term traders. Yet for long-term investors, this selloff may represent a contrarian opportunity. A confluence of macroeconomic shifts and on-chain signals suggests that the market is not in freefall but in a consolidation phase—a setup historically preceding sustained bull runs.
Macro Shifts: Dovish Policy and Institutional Confidence
The Federal Reserve’s pivot toward easing monetary policy has long been a tailwind for risk assets, including cryptocurrencies. In 2020, aggressive liquidity injections fueled Bitcoin’s surge from $7,000 to $20,000, while 2024’s rate cuts and ETF approvals pushed BitcoinBTC-- past $60,000 [1]. Today, the Fed’s hints at rate cuts and slower balance sheet runoff echo these conditions. For instance, Bitcoin’s 5% rebound in late 2024 followed a reduction in monthly balance sheet runoff from $60 billion to $50 billion [4].
Meanwhile, institutional confidence remains robust. Long-term holders now control 74% of Bitcoin’s supply, a 15-year high, indicating that veteran investors see value in the current price [5]. This contrasts with speculative outflows in U.S. Bitcoin ETFs, which lost $1.35 million over four days, driven by stagflation fears [3]. Yet Ethereum’s ETF inflows of $73 million, spurred by SEC clarity on staking, highlight growing institutional adoption [3].
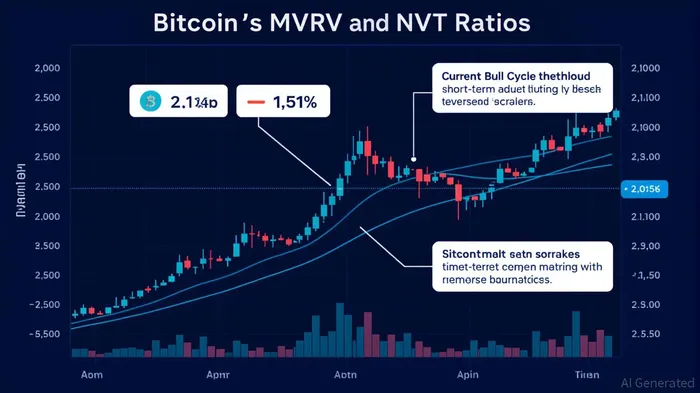
On-Chain Signals: Accumulation and Valuation Metrics
On-chain data reinforces the case for a strategic entry. Bitcoin’s MVRV (Market Value to Realized Value) ratio of 2.1 sits in a “neutral to bullish” zone, while its compression to 1.0 suggests a redistribution from speculative short-term holders to patient long-term investors [5]. Historically, MVRV ratios above 12 have signaled peaks, but the current 3.11 for long-term holders is far from that threshold [1].
The NVT (Network Value to Transactions) ratio, at 1.51, also points to a valuation driven by utility rather than speculation. This metric historically identifies overbought conditions at 2.2, meaning Bitcoin is still below critical resistance [5]. Additionally, the 2-Year Rolling MVRV Z-Score, currently under 1, indicates a prime accumulation phase rather than overbought exhaustion [4].
Risks and Caution
Critics point to rising exchange holdings (up 70,000 BTC since June) and a high MVRV ratio of 18.5% as red flags [6]. Stagflationary signals, such as weak U.S. services PMI data, could also pressure risk assets. However, these risks are already priced into the market. The sell-off has not triggered capitulation—long-term holders remain steadfast, and on-chain liquidity is showing early recovery signs [3].
Conclusion: A Strategic Pause, Not a Breakdown
The current selloff mirrors historical bull market corrections. In 2017 and 2021, MVRV compression and NVT surges preceded all-time highs. With the Fed poised to ease, institutional demand intact, and on-chain metrics favoring accumulation, this pullback may be a buying opportunity for those with a multi-year horizon. As the market absorbs short-term volatility, the path to a potential $300,000 Bitcoin—projected if MVRV reaches 8—remains intact [1].
Source:
[1]
Crypto Bullruns Past and Present
[2]
How Fed Rate Cuts Shape the Future of the Crypto Industry
[3]
Bitcoin (BTC) News Today: ETFs Bleed Millions as U.S. ...
[4]
Crypto Market Macro Research Report: The Federal ...
[5]
Cathie Wood's ARK: Bitcoin's Bullish Momentum Slows ...
[6]
This Week in Crypto, Full Written Summary: W4 August
Decoding blockchain innovations and market trends with clarity and precision.
Latest Articles
Stay ahead of the market.
Get curated U.S. market news, insights and key dates delivered to your inbox.


Comments
No comments yet